
Even when the unrealized P&L on a futures position is green on Bybit, Binance, OKX, or Bitget, the actual closing P&L may be a loss. This can happen when the price used for valuation differs from the actual fill price and the entry and exit fees and funding paid exceed the gain from the price difference. First, match the same instrument, time, and quantity, then compare the actual filled P&L and cost details. Do not deduct fees again from a P&L figure that already includes them.
Official documentation last checked: 2026-10-05 KST · Written and edited by: CoinPop Editorial Team · Scope: P&L reconciliation for general USDT-settled linear futures. The figures below are hypothetical examples for illustrative purposes and do not represent actual account fee rates or trading results on the four exchanges.
Risk and conflict-of-interest disclosure: Cryptocurrency futures involve leverage and forced liquidation, which can result in the loss of collateral. This article is intended to help readers understand how P&L is displayed; it is not a trading signal, a guarantee of profit, or tax advice. CoinPop’s linked exchange guides may contain affiliate links. No sign-up prompts or affiliate calls to action are included in this article.
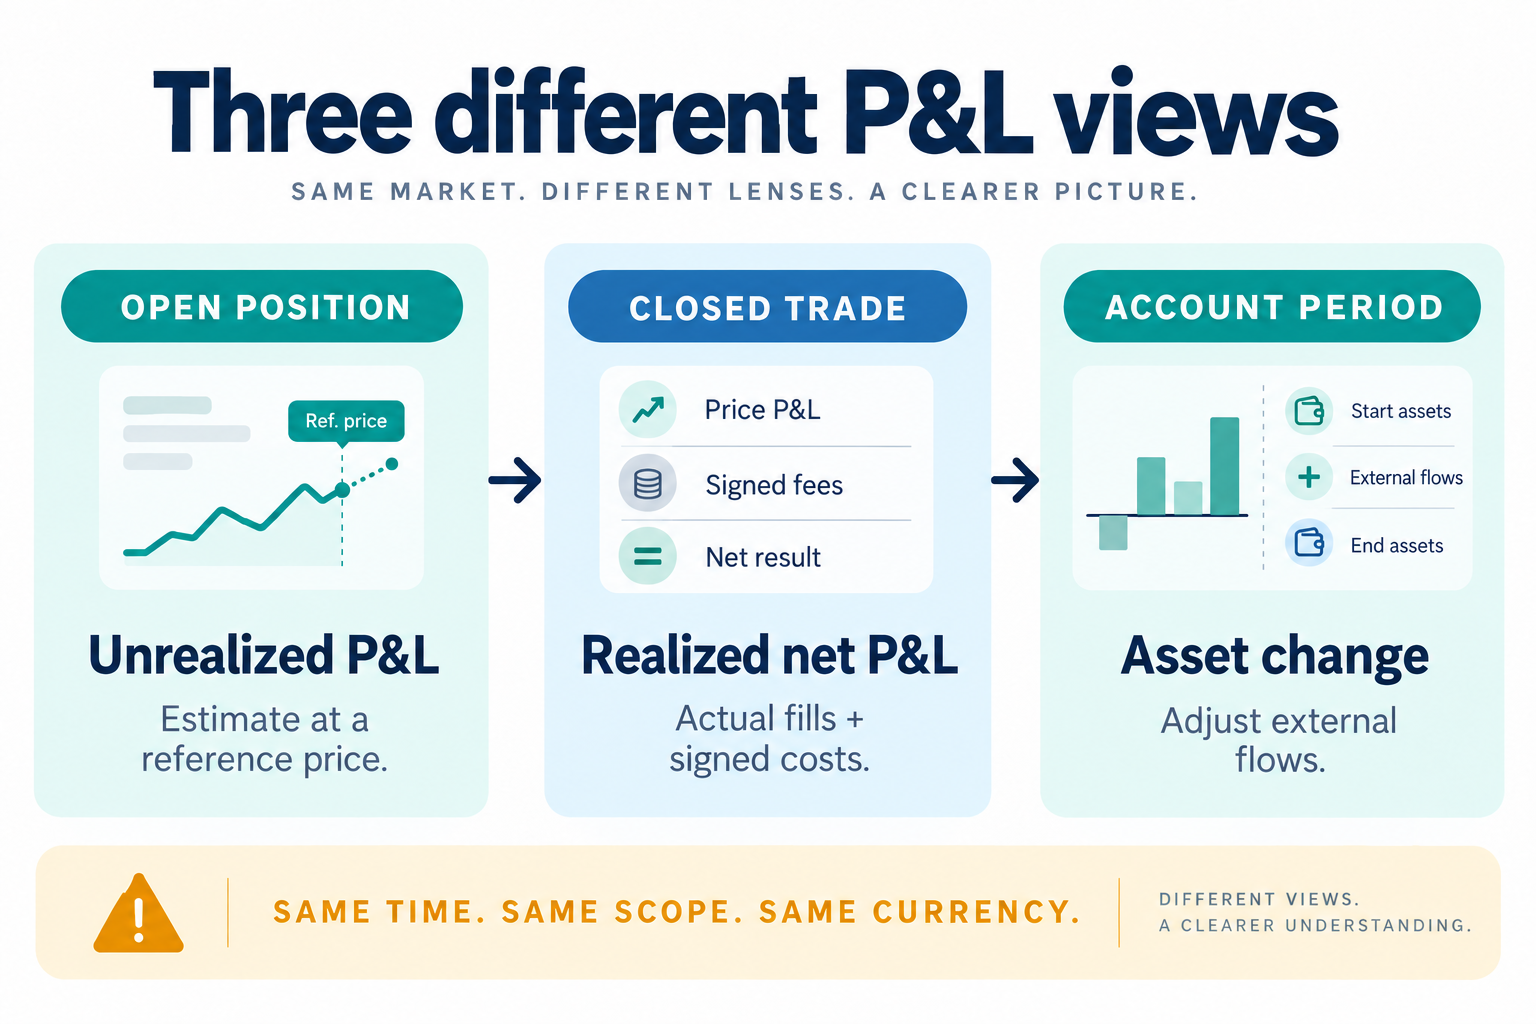
What is the difference between unrealized P&L, realized P&L, and account P&L?
Unrealized P&L is the P&L calculated for an open position using the selected valuation price. Realized P&L is the P&L from closed or settled trades, but the fees and funding included can vary from one screen item to another. Account P&L over a period may combine multiple trades, remaining positions, changes in asset prices, and other factors, so it cannot be directly compared with the closing P&L of a single position.
| Figure being viewed | What to check | Comparison to avoid |
|---|---|---|
| Open-position P&L | Mark price or last traded price, remaining quantity, and whether costs are included | Treating the figure shown just before closing as confirmed profit |
| P&L on a closing trade | Actual filled quantity and price, fee and funding records, and scope of partial closes | Deducting the same costs again from a P&L figure that already includes them |
| Account or daily P&L | Start and end times, net deposits and withdrawals and transfers between accounts, and whether unrealized P&L is included | Counting a balance increase from a deposit as trading profit |
What should you check first on Bybit, Binance, OKX, and Bitget?
The table below compares the items shown in official documentation and the criteria for reconciliation. It is not a ranking of which exchange offers better terms. Displays and menus may vary by product, account mode, app version, and region, so read the descriptions of the items shown on your actual screen as well.
| Exchange | Distinctions in official guidance | When reconciling records |
|---|---|---|
| Bybit | Distinguishes the default display for unrealized P&L from the mark-price-based display. Describes closing P&L as reflecting trading and funding costs. | Check the currently selected valuation price and which costs are included in Closed P&L. Official P&L FAQ |
| Binance | Distinguishes futures PnL and ROI settings from the valuation price basis, and explains that ROI may reflect cost-related items. | Read the PnL amount and ROI percentage separately, and reconcile the selected price basis with fee and funding transaction records. Official futures P&L calculation |
| OKX | P&L from the closing price difference in Order history may include different items from realized P&L reflecting costs in Position history. | Match the order and position records for the same position, and check whether trading and funding costs are already included in realized P&L. Official fee and P&L FAQ |
| Bitget | Distinguishes unrealized P&L, realized P&L, and the P&L of a fully closed position. Cost records use positive and negative signs to indicate amounts paid or received. | Preserve the negative sign for trading fees and the negative sign for funding paid or positive sign for funding received when totaling. Official futures P&L calculation |
For more information about each exchange’s overall account and product structure, see the Bybit user guide, Binance user guide, OKX user guide, and Bitget user guide. This article is not about sign-ups or choosing an exchange; its purpose is to explain the causes of P&L differences using transaction records.
How an unrealized gain of +10 USDT can turn into a final loss
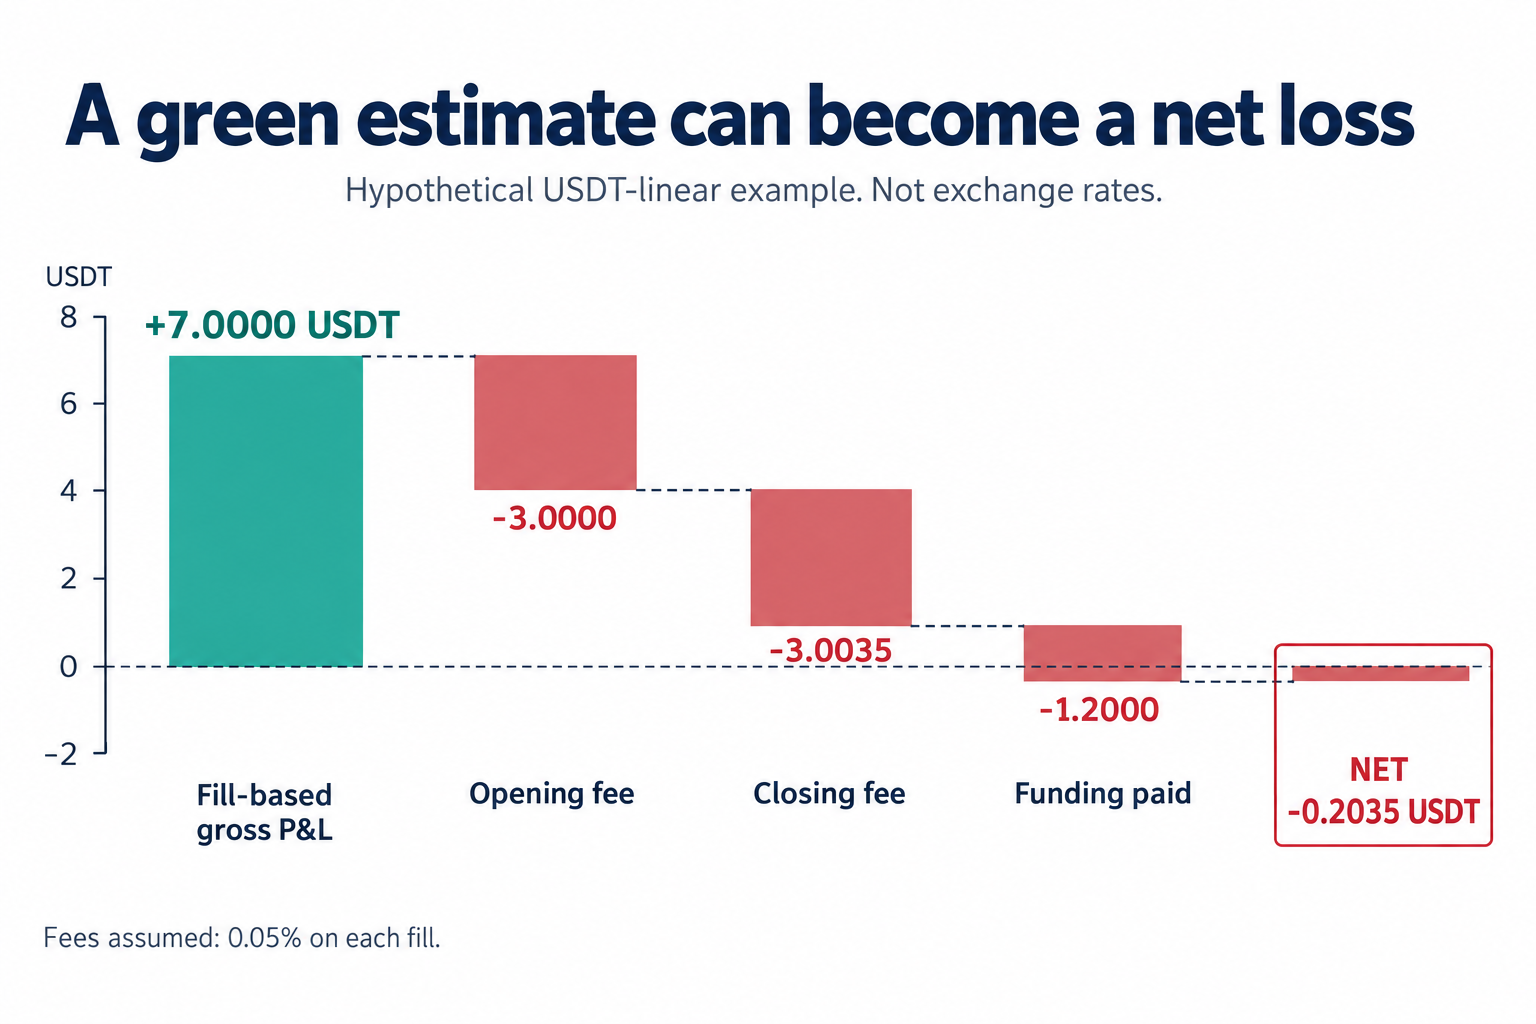
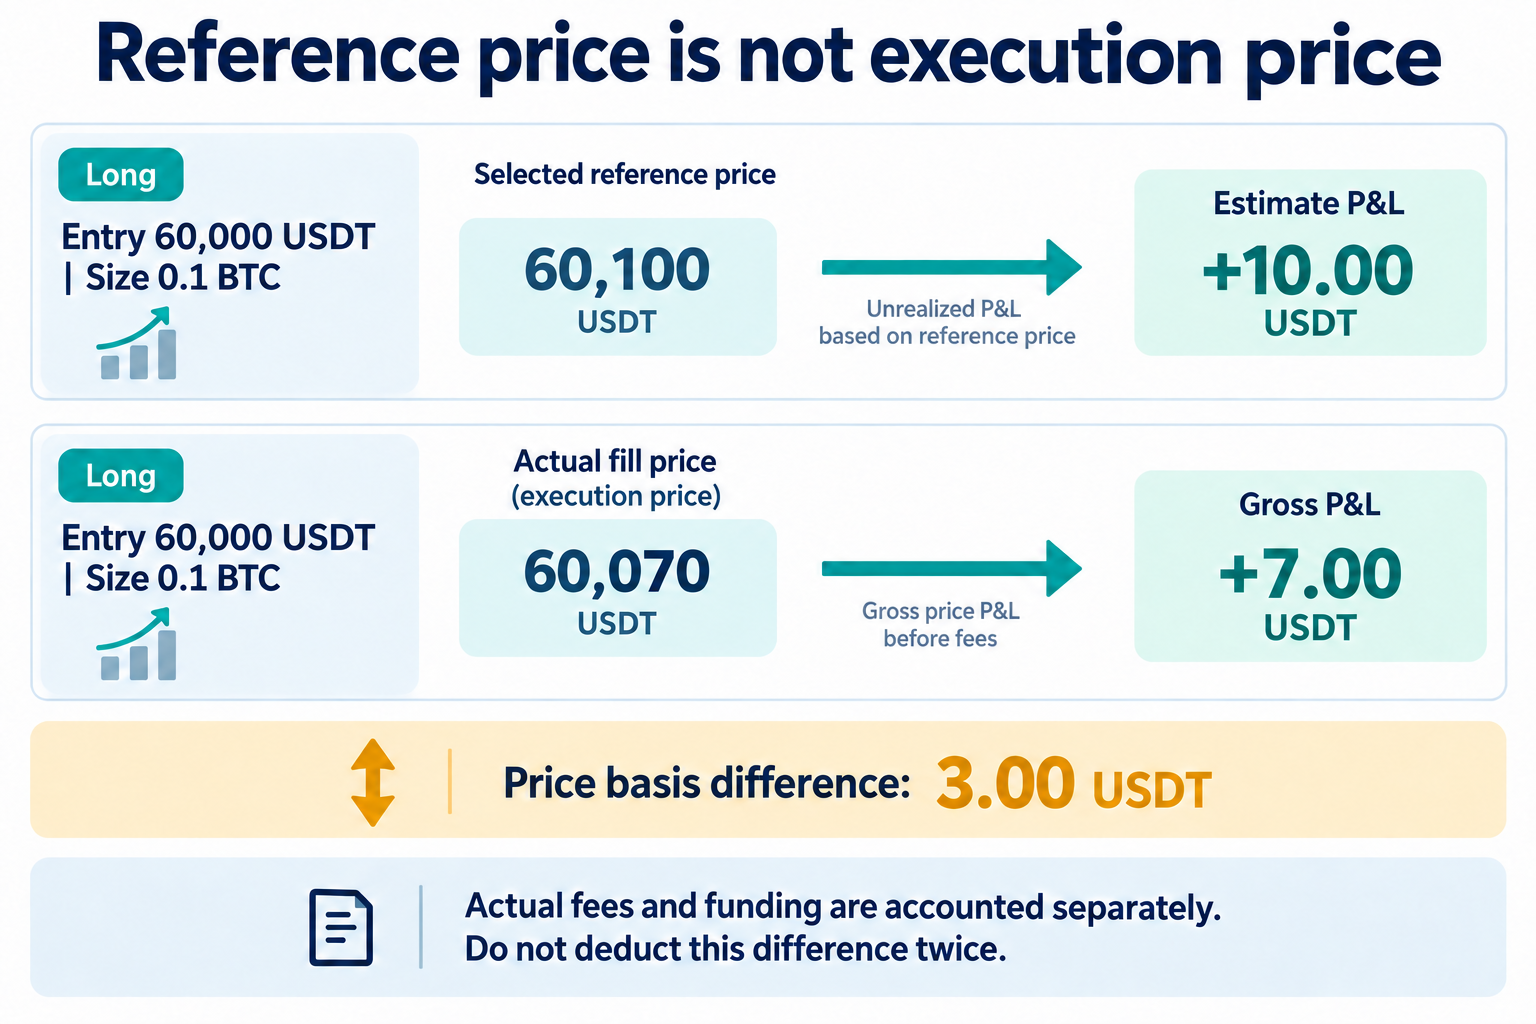
Suppose you open a 0.1 BTC long position in a USDT linear contract at 60,000 USDT. The valuation price just before closing is 60,100 USDT, but the actual average closing fill price is 60,070 USDT. Assume entry and exit fees are each 0.05% of the trade value, and funding paid while holding the position is 1.2 USDT. These rates do not represent the current fees on the four exchanges.
| Item | Calculation | Amount |
|---|---|---|
| Unrealized mark-to-market gain | 0.1 × (60,100 − 60,000) | +10.0000 |
| Price-difference gain at actual execution | 0.1 × (60,070 − 60,000) | +7.0000 |
| Entry fee | 0.1 × 60,000 × 0.0005 | −3.0000 |
| Exit fee | 0.1 × 60,070 × 0.0005 | −3.0035 |
| Funding paid | Assumed to be the actual amount paid | −1.2000 |
| Final net P&L | 7 − 3 − 3.0035 − 1.2 | −0.2035 |
The green +10 USDT did not simply turn into −0.2035 USDT; rather, the gain was reduced by 3 USDT due to the difference between the valuation price and the actual fill price, and the result reflects actual costs of 7.2035 USDT. Even if the price moved in your favor, that does not mean the move was enough to cover all costs.
Why you should not deduct spread or slippage again
The 7 USDT price-difference gain calculated using the actual fill price of 60,070 USDT already reflects that the fill price differed from the valuation price. If you then deduct the 3 USDT difference from the valuation price again as a “slippage cost,” you count the same difference twice. A report analyzing costs between the expected and actual fill prices must be distinguished from a P&L report based on the confirmed actual fill.
What price makes net P&L zero after fees and funding?
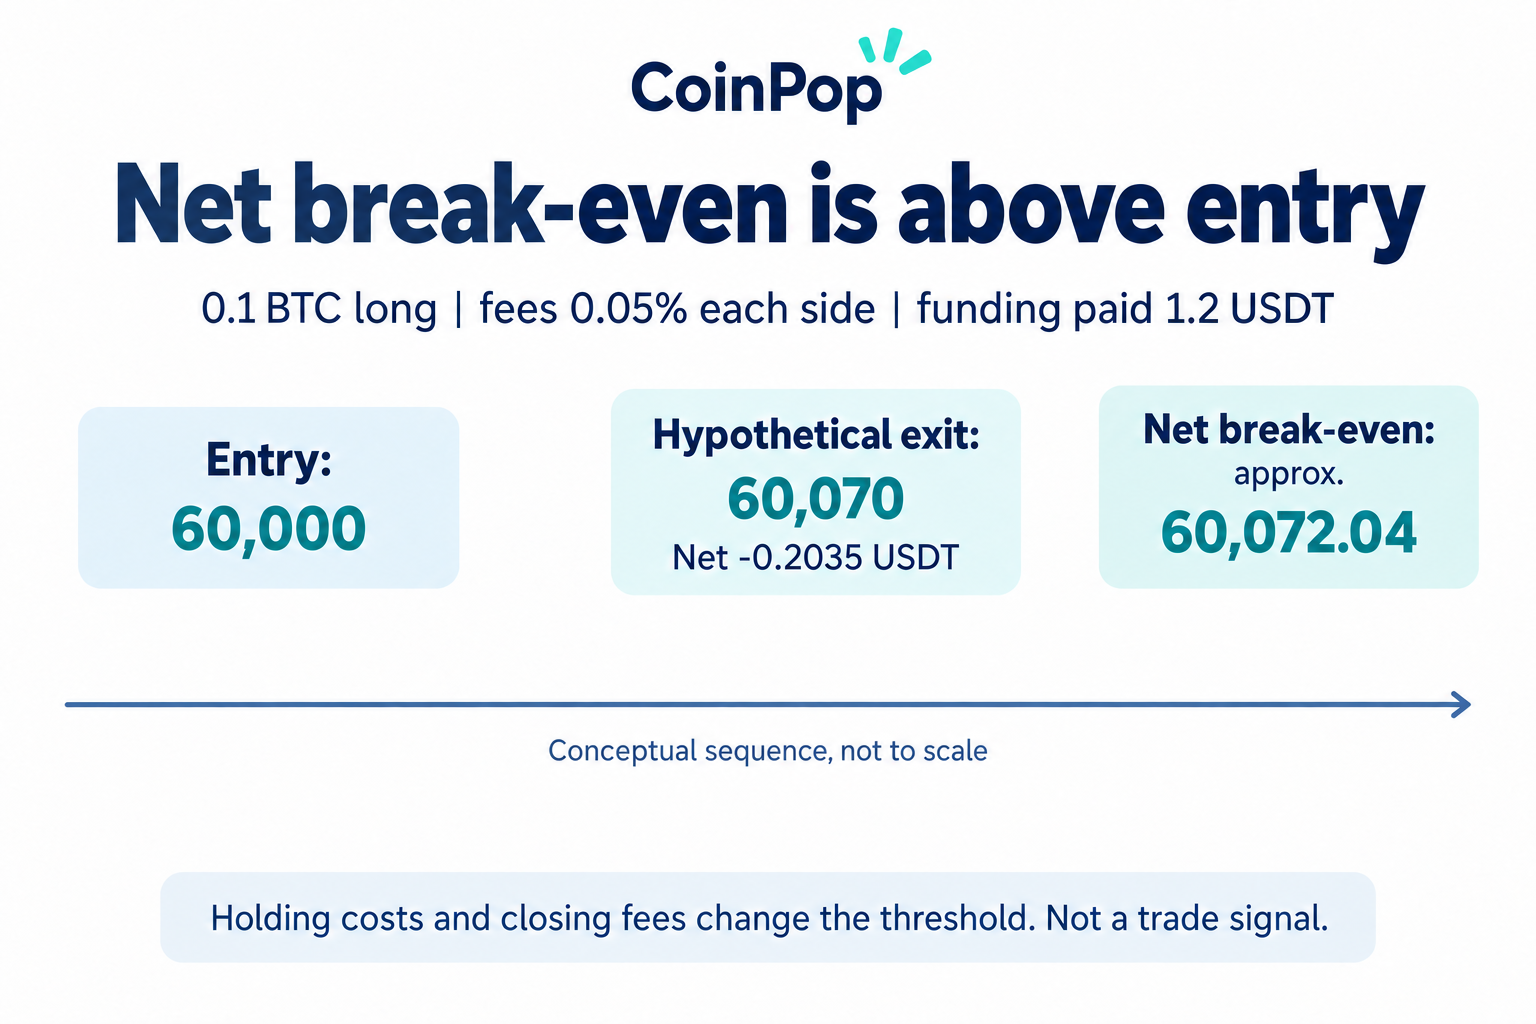
For the long position above, let P be the actual closing price, q the quantity, E the entry price, a the entry fee rate, b the exit fee rate, and F the net funding paid. Net P&L is q × (P − E) − q × E × a − q × P × b − F. If funding was received net, enter F as a negative value. Enter fee rates as decimals, not percentages.
Setting net P&L to zero and rearranging gives P = [E × (1 + a) + F ÷ q] ÷ (1 − b). Substituting the hypothetical values E=60,000, q=0.1, a=b=0.0005, and F=1.2 gives P = approximately 60,072.04 USDT. Closing at 60,070 leaves the price-difference gain insufficient to offset all assumed costs.
Exclusions: Do not apply this simple formula as-is to inverse or coin-margined contracts, interim settlements, multiple additional entries or partial closes, conversion of fees into another currency, or trades involving rebates, borrowing interest, or liquidation-related costs. The breakeven price shown by an exchange may also differ in the costs it includes and the time at which it is calculated. This is a calculation verification tool, not a sell target or trading signal.
Does changing leverage also change the P&L on the same trade?
It is important to note that if the quantity, entry price, and exit price are all the same, changing only the leverage setting leaves the P&L from the price difference unchanged. However, initial margin, the denominator used for ROI, available collateral, and liquidation risk may change. If you also increase the position quantity using the same margin, the P&L amount will change as well, so do not state without qualification that “leverage does not affect P&L.”
Also, the position return percentage and the overall account return are different metrics. Do not compare ROI figures alone; consider the P&L amount, the denominator, and whether costs are included. For more details on how holding costs arise, see How funding fees are calculated and when they are paid.
A five-step checklist for reconciling your P&L
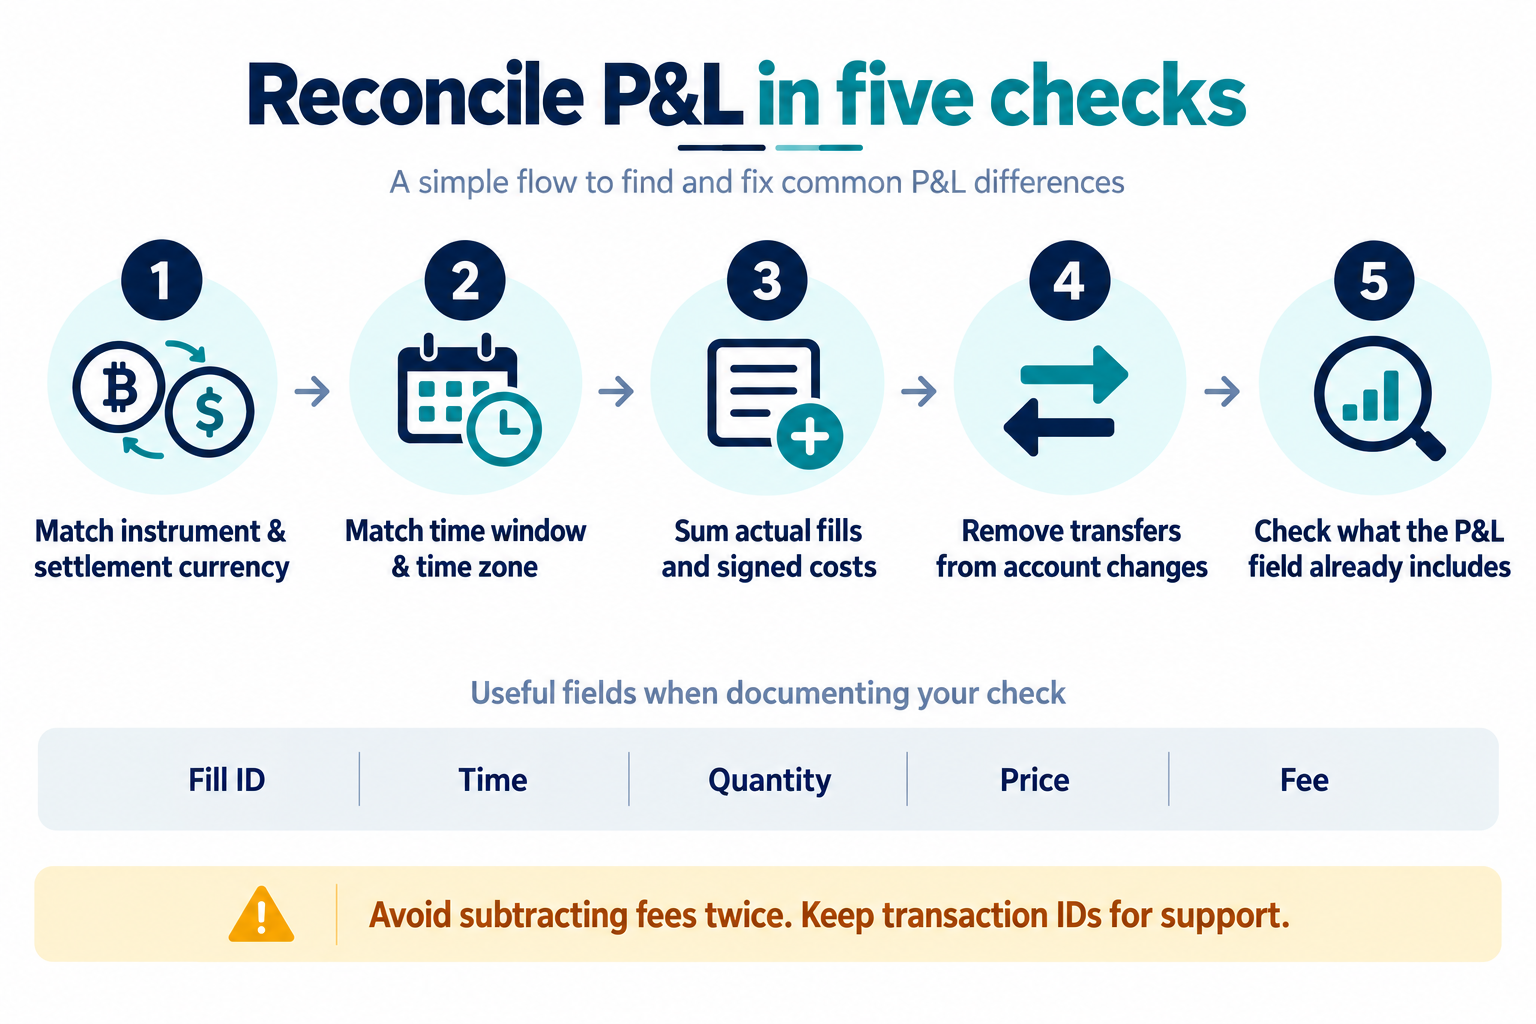
- Match the instrument and currency. Do not mix BTCUSDT with BTCUSD inverse contracts, or spot with futures. If fees were deducted in another coin, record the conversion basis as well.
- Match the period and time zone. Gather order, fill, and funding records for the same start and end times. If the date boundaries differ between UTC and KST, daily P&L may not match.
- Reconcile actual fills, not orders. A single order may fill at multiple prices. Match the quantity, average entry price, exit fill price, any partial closes, and each fee. Preserve the payment or receipt sign for funding.
- Separate account transfers. Do not compare the P&L of one position with changes in the account balance. Record amounts entering and leaving from outside the account scope, and decide whether to include internal transfers based on the scope of the accounts being compared.
- Recheck the included items at the end. If the displayed realized P&L already includes trading or funding costs, do not subtract those costs again. Categorize any remaining differences as rounding, another settlement currency, interest, other asset movements, and so on.
Items to include in your reconciliation notes
Record the exchange, instrument, settlement currency, review period and time zone, trade and fill IDs, direction, quantity and price, entry and exit fees, funding paid or received, whether there were partial closes, the displayed item names, and the scope of costs included. Submit only the necessary records to customer support through official inquiry channels, and do not send API secret keys, passwords, OTPs, or wallet seed phrases. You also do not need to create a new API key to follow this article.
You do not need to place a new trade or make an additional deposit to find the cause. If the difference cannot be explained using records from the same scope, ask the exchange for the basis of its calculation. We did not log in to any real account or test live trades here; we used official documentation and independently prepared hypothetical calculations.
Frequently asked questions
Why is unrealized P&L positive on Bybit, while exit P&L is a loss?
The selected mark price may differ from the actual exit fill price, or trading and funding costs may exceed the gain from the price difference. Match the components of Closed P&L against the actual fill records, then check that costs have not been deducted twice.
Which should I compare on Binance: PnL or ROI percentage?
Check the P&L amount and, for the percentage, its denominator, price basis, and included cost scope separately. A higher ROI alone does not mean that more realized profit was made.
Is it an error if the profit shown in OKX order history differs from that in position history?
According to the official guidance, the two items may differ in the costs they include, so a numerical difference alone does not establish an error. Separately reconcile the price-difference P&L, trading fees, and funding records for the same position.
If the Bitget funding fee is positive, does that mean I paid a fee?
The official Bitget P&L guidance reviewed for this article describes funding payments as negative and receipts as positive. The funding rate shown on screen and the amount in the actual funding records are different items, so read the sign together with the item description.
If my account balance increases, does that mean I made that much in futures profit?
No. Deposits, withdrawals, account transfers, other positions, and changes in asset prices can all affect it. Define the account scope, separate external cash flows, and then compare.
Can I use the 0.05% in this article as my fee rate?
No. It is an assumed rate used for illustration. Recalculate using the rate and actual deductions applicable to the products, Maker/Taker status, tier, and regional conditions of your account.
Official sources and scope of verification
- Bybit — FAQ: P&L Calculation: Mark price, cost-inclusive exit P&L, and leverage comparison with quantity held constant. Update date displayed in the document: 2026-08-12.
- Binance — How to Calculate Profit and Loss for Futures Contracts: PnL, ROI, and price basis. The page reviewed is a regional en-ZA document; not all account screens were verified.
- OKX — Trading Fee Rules FAQ: Scope of costs included in order and position P&L. The page reviewed is a European regional document, so prioritize the actual guidance for your region and product.
- Bitget — How to Calculate P&L on Futures Trading?: P&L types and the signs for fees and funding. Publication date displayed in the document: 2025-04-04.
The verification date is the day CoinPop checked the official documentation and differs from the publication date of the exchange documents. Policies, menus, and calculation displays may change. The hypothetical calculations assume simple linear contracts and do not provide live trading results, current prices, or price forecasts. If an error is confirmed, we will issue a correction specifying both the source and the scope of the calculation.