
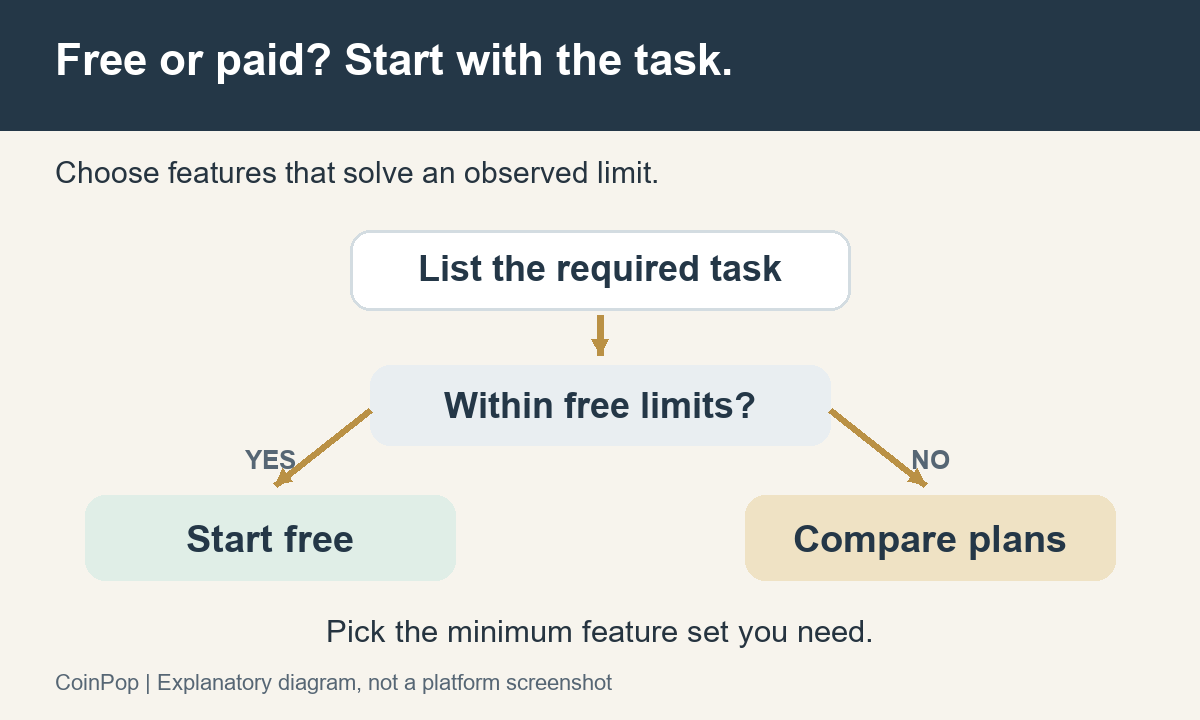
TradingView is a platform for viewing charts, organizing indicators and watchlists, and using alerts and analysis tools that meet your needs. You do not need to choose a paid plan from the outset. It is more sensible to first confirm that the instruments and data you need are available, then compare the minimum features required only when your actual work runs into free-tier limits.
Updated and sources checked: October 26, 2026 · Writing and editorial responsibility: Hyun Lee. This article explains how to choose and configure the tool and does not provide personalized trading signals. Prices and features are observations from the verification environment, so check the billing and renewal terms on the official screen before paying.
1. What you can and cannot do with TradingView
TradingView’s advantage is that it lets you organize charting and analysis across multiple markets in a consistent format. You can bring together watchlists, change timeframes, compare indicators, and turn conditions into alerts as part of a connected workflow. However, having a tool organize information does not automatically make your investment decisions more accurate.
Charts and trading accounts are separate
Just because an exchange has a TradingView-style chart does not mean that a separate paid TradingView subscription will also apply to the exchange’s interface. Being able to view an exchange’s prices on TradingView does not mean you can connect that exchange account and place orders for every product. Check direct trading availability separately based on the supported broker or exchange, product, region of residence, and account permissions.
2. From signing up on the PC web to your first chart and price alert
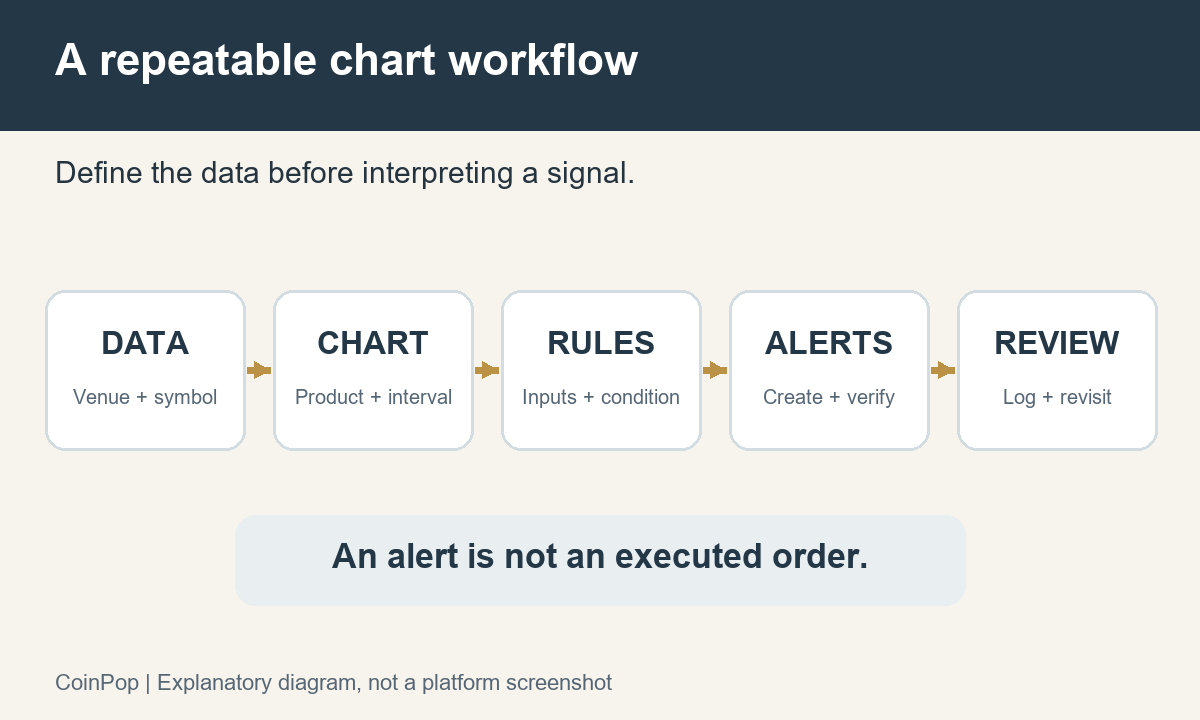
The basic PC web sequence is verify your account → select an instrument → set a timeframe → add indicators → save a layout → create an alert. Do not configure everything at once; check the completion indicator at each step before moving on. The button names below were verified in the Korean-language Supercharts interface on October 26, 2026. Depending on the window width and account status, they may appear as icons or abbreviated names. When first learning the interface, you can learn the chart features without connecting an order panel.
Step 1: Start with a free account and check your login status
On the official TradingView website, open the Get started or Sign up option and choose one of the available registration methods. If you sign up with email, complete the email verification requested on screen; if you already have an account, sign in with that same account. Read the authentication steps or terms-and-conditions screens for the registration method you choose. This article does not assume that a particular registration method will always be available or perform verification on your behalf.
Completion check: You can find your account in the user menu and open Supercharts. You do not need to complete a paid transaction before creating a free account. Creating a free account and trying or purchasing a paid plan are separate steps, so if you are asked to enter card details or confirm auto-renewal, first read which product you are starting. Saved charts and subscriptions may appear differently if you are signed into another account.
Start a free account on the official website
This is an affiliate link. If a page opens in another language, select your preferred language from the user menu.
Step 2: Click the instrument name in the upper left and select the data provider too
Click the current symbol at the upper left of the chart to open the symbol search box. Enter a search term, then review the instrument name, exchange, and product in the result row before selecting it. For example, if you want to see spot prices but select a futures or perpetual contract result, it will mean something different even if it is the same coin. Rather than automatically choosing the first result with a similar name, search with the exchange prefix included to make it easier to verify.
Completion check: The instrument, display currency, and exchange in the chart legend match the combination you intended. Do not consider setup complete just because a price appears. If the instrument does not appear in search, check the spelling, exchange filter, and product type; do not guess at a name and record it as though it were an actual symbol. Data delays and market-closed status are also items to check separately from whether a search result exists.
To make the chart reproducible, record the symbol, exchange, spot/futures type, display currency, timeframe, data provider, delay indicator, session, time zone, and the date and time checked. The name BTCUSDT alone is not enough to specify the conditions. Real-time exchange data permissions may be required separately from a chart subscription. For the actual order process, the Bybit guide to checking orders, stop-losses, and position closures distinguishes chart observation from order confirmation.
Step 3: Change the timeframe in the interval menu at the top
Open the interval menu to the right of the symbol, or click a visible timeframe button. The PC screen we checked showed buttons for 1 minute, 5 minutes, 15 minutes, 30 minutes, 1 hour, 4 hours, and 1 day, as well as a full interval menu. When first comparing the same market, save views with different purposes separately, such as the 1-hour and 1-day charts. Changing from a minute chart to a daily chart does not mean choosing a more accurate forecasting method; it changes the time span represented by each bar.
Completion check: The selected timeframe at the top matches the interval in the chart legend, and the spacing between bars on the horizontal axis changes. One bar on a 1-hour chart groups price information for a 1-hour period; it is not a forecast of the price one hour later. Daily bar boundaries are affected by market sessions and time zones, so record the time zone and reference bar when comparing different exchanges.
Step 4: Add the indicators you need from the Indicators button at the top
Click the Indicators, Metrics & Strategies button at the top and search for the indicator you need. Distinguish built-in indicators from community scripts, and do not mistake a script with a similar name for an official built-in indicator. It is best to start with an item that has a clear purpose, such as a single moving average, then check its period and applied price in the indicator legend settings.
Completion check: The indicator appears over the price chart or in a separate pane, and you can review its legend name and input values. If you accidentally added the same indicator twice, remove one. If you reach the free indicator limit, first remove indicators you do not use; compare paid limits only if you actually need more of the indicators that matter. Adding an indicator and running the Strategy Tester are not the same task.
Step 5: Name the layout and reopen it to check
Check the layout name and save area in the upper right. The layout management menu includes options such as save, autosave, rename, and open layout. When starting new work, it is easier to manage if you use a separate work name within the available limit rather than overwrite an important existing layout. For example, include the purpose in the name, such as “BTC Spot 1-Hour Watch,” and check the save status.
Completion check: After checking the save status, reopen the layout and compare the symbol, timeframe, indicators, and input values. If the Save button is disabled and the screen says all changes are saved, there may be no unsaved changes. Depending on whether autosave is enabled, your actions may remain in the existing view, so check the current layout name before following someone else’s instructions.
The fact that a layout is saved does not mean an alert is active or an order has been submitted.
Step 6: Create a price alert and check its active status in the manager
With the desired symbol open, click Create alert at the top. On Windows, Alt+A is also an access method listed in the official instructions. In the alert window, review the symbol → price condition → operator, such as crossing, greater than, or less than, and threshold → trigger frequency → expiration → message → delivery method, in that order. The screen we checked had fields for condition, trigger, expiration, message, and notification, along with a Create button. After entering values, check the decimal places and display currency again.
For example, if your observation goal is “check once when the price crosses above a specific level,” choose a direction and frequency that match that intention. Set the reference price yourself at the level you want to monitor; this article does not suggest buy or sell price levels. Before creating the alert, confirm the instrument is correct, whether you need repeat notifications, and which device will receive them. Do not create an unnecessary alert, or close it by canceling.
Completion check: After creation, the item appears in the alert manager on the right, where you can review the symbol, condition, active status, and expiration date. Delivery testing is complete only after you have confirmed that the actual condition occurred and the device received the alert. The fact that the setup window opened does not mean the alert was created, triggered, or received. Official introduction to alerts
3. Checking charts, layouts, and alerts in the mobile app
Because features are tucked away on the mobile app’s small screen, do not assume that every PC button will be in the same place. Open the official app, sign in with the account you use on the web, find the desired instrument in your watchlist or search, and open its chart. Then check the exchange, display currency, and timeframe, and confirm that the saved layout and required indicators are correct. Menu locations may vary depending on the app version and operating system.
When you just want to check prices quickly on a phone, it is better to reduce the number of items to read than to fit both indicators and drawings on one screen. Even when using landscape view or a separate panel, make sure the current candle, timeframe, and data status are not obscured. Do not confuse zooming the chart in or out with changing the timeframe. If a saved screen looks different, first compare the account and layout names. Settings changed on mobile may affect work on other devices, so take care not to overwrite important existing screens.
App notifications do not turn on simply because a chart is open. Check both the app’s notification-receiving option and your phone’s notification permissions, and separately verify that the condition-trigger history and actual delivery are working. Being able to use a web subscription created on a PC in the app under the same account is a separate matter from paying separately through the app store. When comparing a new purchase, read the web pricing and terms above first. If you already have an app subscription, manage it through the original payment provider.
4. South Korean Market Example: Upbit, Bithumb, and Kimchi Premium Comparison Chart
How to distinguish Upbit and Bithumb symbols from overseas exchanges
In the actual symbol search on the Korean-language PC website, UPBIT:BTCKRW, BITHUMB:BTCKRW, BINANCE:BTCUSDT, FX_IDC:USDKRW the results were confirmed. The first two are spot Bitcoin/KRW markets on Upbit and Bithumb, respectively; the third is Binance spot Bitcoin/USDT; and the last is a feed used to compare the USD/KRW exchange rate. These are examples of confirmed symbols, not a guarantee that every coin and exchange combination is available.
After selecting a search result, read the price unit once more. If you place the numbers from KRW and USDT charts side by side and compare only their magnitudes, exchange-rate differences are mixed in. Choosing a perpetual contract instead of spot also introduces funding and basis effects. First align the same product, same time, and same units; only then can you explain what the comparison value means.
State the conversion assumptions first in a Kimchi Premium comparison chart
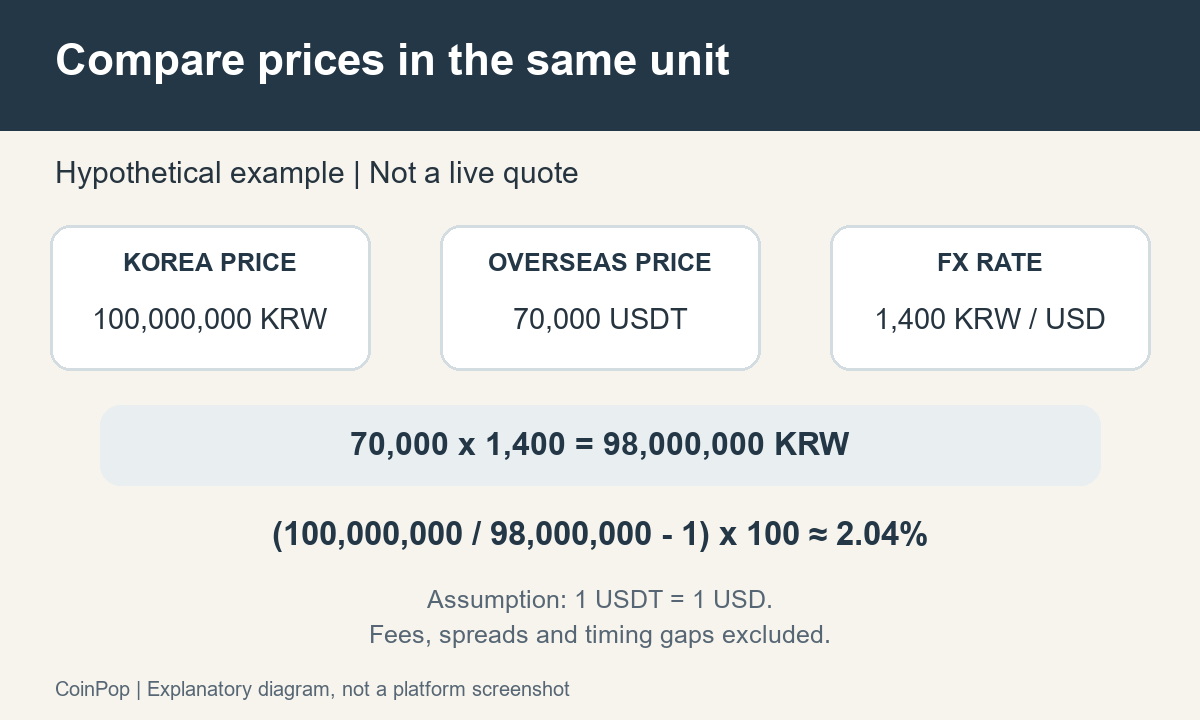
The illustrative calculation is Kimchi Premium (%) = [Korean price in KRW ÷ overseas price converted to KRW − 1] × 100. If the overseas price is in USDT and is converted using the USD/KRW exchange rate, this adds the approximate assumption that USDT = USD. When that assumption does not hold, the USDT/USD difference must also be accounted for. Do not interpret a simple converted indicator as an arbitrage profit that can be realized in cash.
You can use a spread chart that supports entering formulas in symbol search. An illustrative formula based on the four symbols above is (UPBIT:BTCKRW/(BINANCE:BTCUSDT*FX_IDC:USDKRW)-1)*100To compare against Bithumb, BITHUMB:BTCKRWreplace the first term with this and apply the same definition. First check each individual symbol separately, then enter the formula and verify that the result is in percent. For supported ranges such as intraday intervals, check the formula-chart limits for your account and plan.
For example, assuming a Korean price of 100,000,000 KRW, an overseas price of 70,000 USDT, and an exchange rate of 1,400 KRW/USD, the converted value is 98,000,000 KRW and the comparison value is about 2.04%. This is a calculation exercise, not a current quote. It excludes fees on both sides, withdrawal costs, bid-ask spreads, transfer time, and currency conversion costs. Mixing data from different times or an exchange rate during a market closure will increase the comparison error further.
Past candles on a synthetic chart are affected by how each underlying data series is aggregated, and values may change after recalculation. The meaning of the latest real-time value is also different from that of past highs and lows. Check the official explanation of spread charts, and when comparing it with Coinpop’s Kimchi Premium and market sentiment page, first make sure the exchange, exchange-rate source, and update time are the same. This does not cover ways to use indicator differences to circumvent regional restrictions or rules on moving funds.
5. When Free Is Enough and When to Consider a Paid Plan
Start by defining what you can do on the free plan
For beginner tasks such as viewing one asset on one chart and comparing only a few required indicators, you can start by checking the free plan. It is more important to understand what each indicator calculates than to add many indicators. There is no basis for describing the difference between free and paid plans as a difference in analytical accuracy or returns.
The Basic limits listed in the official comparison table checked on October 26, 2026, were one chart per tab and two indicators per chart. The same table showed technical alerts and webhooks as unavailable on Basic. Price alerts and technical alerts are different types, so do not interpret this as “the free plan has no alerts at all.” Official feature comparison table (affiliate link)
Choose based on a feature you have actually hit the limit on
| What you need to do now | What to try first | When to compare paid plans |
|---|---|---|
| Check price and basic indicators on one chart | Set up within the free limits | The required indicators or number of simultaneous charts are genuinely insufficient |
| Compare multiple assets and timeframes simultaneously | First record how many comparison screens you need | Check the least expensive plan that meets the required quantity |
| Indicator-condition or webhook alerts | Distinguish price alerts from conditions and delivery methods | Check technical-alert support, quantity, and webhook requirements |
| Validate a strategy using additional history | Specify the required period, data, and cost assumptions | The history and features required for validation are beyond the current limits |
6. Check Pricing, Total Cost, and Data Delays
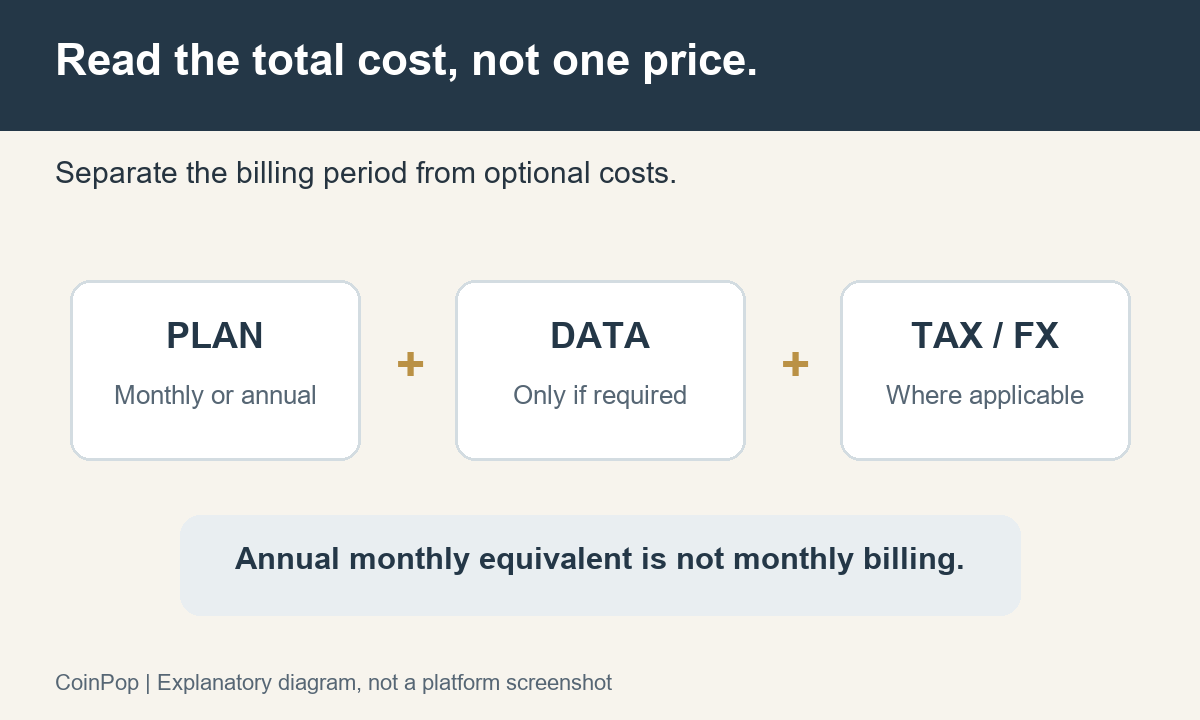
Distinguish monthly billing from the monthly equivalent of annual billing
The amounts below are listed values observed in USD on the Korean-language web pricing page on October 26, 2026. They are not confirmed final charges from the checkout screen. The page also displayed special pricing, so these should not be assumed to be permanent standard prices or renewal prices applicable to all visitors.
| Plan | Monthly billing | Monthly equivalent of annual billing | Annual total |
|---|---|---|---|
| Essential | $14.95 | $12.95 | $155.40 |
| Plus | $34.95 | $29.95 | $359.40 |
| Premium | $69.95 | $59.95 | $719.40 |
| Ultimate | $239.95 | $199.95 | $2,399.40 |
Open the free-start and plan comparison page
This is an affiliate link. Available options for free accounts and paid plans vary depending on login and subscription status. No discount or reward is promised.
An annual monthly equivalent of $12.95 does not mean you will be charged $12.95 each month. The displayed annual billing total is $12.95×12=$155.40. Before paying, review the currency, taxes, initial payment and renewal terms, and cancellation and refund terms. If the current values differ, prioritize the official pricing page (affiliate link) and the actual payment terms.
Compare annual billing savings with monthly billing for the same plan
The formula is (monthly payment − monthly equivalent of annual payment) ÷ monthly payment × 100. The annual difference is calculated by subtracting the annual total from 12 times the monthly payment. The results below use only the listed values in the table above and are rounded to two decimal places. They are not estimates that additionally account for introductory offers, renewal prices, taxes, or currency-conversion costs.
- Essential: (14.95−12.95)÷14.95×100 ≈ 13.38%. Twelve monthly payments total $179.40, while the listed annual total is $155.40, a difference of $24.
- Plus: (34.95−29.95)÷34.95×100 ≈ 14.31%. The difference between $419.40 and $359.40 is $60.
- Premium: (69.95−59.95)÷69.95×100 ≈ 14.30%. The difference between $839.40 and $719.40 is $120.
- Ultimate: (239.95−199.95)÷239.95×100 ≈ 16.67%. The difference between $2,879.40 and $2,399.40 is $480.
Even when the monthly equivalent is lower, annual billing requires a larger upfront payment. In the Essential example, 10 months of monthly payments total $149.50, less than the annual total of $155.40, while 11 months total $164.45, which is more. This is only an arithmetic comparison assuming the same terms continue; it does not indicate any refund for early cancellation or the cost of changing plans. If you are unsure how long you will use the service, compare not only the equivalent rate but also the total amount you will actually pay and the refund terms.
Review the terms on the web, but do not pay twice for an existing app subscription
If you are comparing plans as a new subscriber, we recommend reviewing the plan and billing period on the web pricing page, then checking the linked terms of service and cancellation and refund information. A single pricing page does not confirm the final taxes or refund eligibility for every account. Just before paying, review the selected plan, billing currency, total, and renewal date again, and keep a record of the relevant terms. Turning off auto-renewal and getting a refund for an amount already paid are separate processes.
The official guidance says that web subscriptions can also be used on mobile and desktop devices with the same TradingView account. Conversely, existing subscriptions purchased in the app are subject to the management and change terms of their original payment platform, so do not cancel them automatically or pay twice using a new account just to make a web purchase. Guidance on using a subscription across devices · Important information about changing payment platforms
Apply only the confirmed terms for paid trials and seasonal promotions
The official pricing comparison includes a free-trial option, but the current terms of service state that the duration varies by plan, region, and platform, and is shown on the start screen. This article does not promise a universal “30-day free trial.” Before selecting a trial, check on your own screen the applicable duration, whether a payment method is required, when and how much you will be charged upon conversion to a paid plan, and how to turn off renewal. Official payment, trial, and refund terms
For seasonal offers such as Black Friday, we will update this section after the official announcement with the eligible plans, new or existing account eligibility, offer period, and initial payment and renewal terms. This article currently does not include any unannounced discount rate or start date. Clicking an affiliate link alone does not activate a particular seasonal price or add an extra discount.
Check exchange data, taxes, and professional status separately
Total costs may include more than just the subscription fee. According to the official guidance, real-time data fees for some stock and futures exchanges are not included in paid chart plans. The terms and fees may also vary depending on whether you qualify for professional or non-professional data status. Professional classification does not simply mean having extensive investment experience. Official market data guidance
Read delay indicators differently for Korean and U.S. stocks
In the official data coverage table as of October 26, 2026, free feeds for KRX stocks and funds were shown as delayed by 20 minutes. KRX indices appear on a separate row in the same table, so it would be inaccurate to describe all Korean market data as uniformly delayed by 20 minutes. Check the market status and data provider for the symbol you are viewing. The fact that sufficient historical bars are visible does not prove that you are receiving current trade prices in real time.
According to official guidance, basic U.S. stock data is provided by Cboe and may differ from feeds from the primary listing exchanges. Therefore, do not claim that all U.S. stocks are “delayed by 15 minutes” or that free screens show all NASDAQ and NYSE trading within the same scope. The official coverage table also distinguishes limited real-time data based on Cboe from real-time subscriptions for primary exchanges. Market-by-market data coverage, delays, and subscription terms
You can check the exchange subscription prompted by selecting the chart’s market status, or go to Settings and Billing → Subscriptions → Real-Time Market Data in your account. List paid chart plans and exchange data subscriptions separately, and accurately select your professional or non-professional status and intended use. Recognition of data entitlements through certain broker integrations must be checked separately against the broker and account terms; do not assume that logging in on another device will automatically give you the same entitlements.
7. Learn Indicators, Alerts, and Pine Script
Indicator settings are hypotheses to test
Moving averages smooth prices, RSI summarizes strength based on rises and falls over a set period, and Bollinger Bands show the average and volatility together. We do not provide a best setting that applies the same numbers to every market. When changing settings, keep the exchange, instrument, and timeframe fixed and compare one item at a time so you can identify what changed.
Read about the specific uses and interpretations of indicators alongside the existing Guide to RSI, Bollinger Bands, and Moving Averages. Also check whether multiple indicators repeat similar information, react late, or look different in ranging and trending markets.
At first, one comparison question matters more than two indicators
For example, if you want to see “how far the closing price is from the average,” use one moving average with a fixed period and read the price and line at the same point on the chart. If you add RSI, you should be able to explain why it summarizes the strength of price changes separately from the distance from the average. Distinguish the fact that a color changed or lines crossed from the claim that this will lead to future profits. This exercise does not recommend any specific period or threshold as a profitable setting.
For your initial settings record, note the indicator name, whether it is built-in or community-developed, input period, applied price, symbol, and timeframe. Change only the period, then compare how many signals were added and how the indicator looked in different historical intervals. If you change several inputs and exchanges at once, it will be difficult to track the cause of the changes. Hiding an indicator, removing it from the chart, and resetting its inputs are also different actions, so record any settings you need first.
An alert is a notification of a condition, not an order
Check price conditions, indicator conditions, and alert delivery methods separately. Having a condition in Pine Script does not automatically create an active alert. According to the official documentation, alerts you create use copies of the script, inputs, and other settings, so you may need to recreate existing alerts after changing the original code. Pine Script Alert FAQ
When an alert does not arrive, diagnose creation, triggering, and receipt separately
- Check creation: Confirm that the alert is actually listed in the Alert Manager and is not inactive, expired, or affected by an alert limit.
- Check conditions: Review whether the selected symbol, price or technical conditions, direction, frequency, bar-close setting, and timeframe match your intent. Do not confuse price alerts with indicator-condition alerts.
- Check triggering: Check the alert log to see whether the condition was triggered. Do not assume it triggered just because the chart looked similar.
- Check receipt: If there is a trigger record but no alert on your phone, check that you are signed into the same account, that app notifications are selected, that notifications are allowed by the operating system, and that Do Not Disturb is not enabled.
- Check for changes: If you changed indicator inputs or the script, check whether the existing alert is still using the old conditions. If necessary, clean up the existing alert and create a new one with the updated conditions.
For example, if there is no log at all, it is faster to check the conditions and expiration before changing your phone’s sound settings. If a log exists but nothing appears in the app, check the delivery path rather than redrawing the chart. Making this distinction can help avoid creating duplicate alerts or upgrading your plan unnecessarily. If an actual alert is connected to an order system, manage the automated order path under separate safety procedures until the cause has been identified.
Check code version and execution status separately
The current official Pine Script documentation is for v6. For beginners, it is easier to verify a simple example, such as an indicator that plots a single moving-average line, than a strategy that submits orders. Syntax review, successful compilation, display on the chart, and real-time condition behavior are separate verification stages. Record which stages you have checked. Official first-indicator example
8. Exchange Integrations and Webhooks
| Configuration | What it means | What to check separately |
|---|---|---|
| Exchange-integrated chart | Chart feature on an exchange screen | Whether it is the same as a separate TradingView account feature |
| TradingView account and subscription | Platform features and usage limits | Data entitlements and trading accounts are separate |
| Direct Trading Panel integration | Connecting an order route through a supported account | Country, broker, instrument, entitlements, and order support |
| Webhook | A condition alert sent to an external address | Receiving system, security, whether orders are processed, and failure handling |
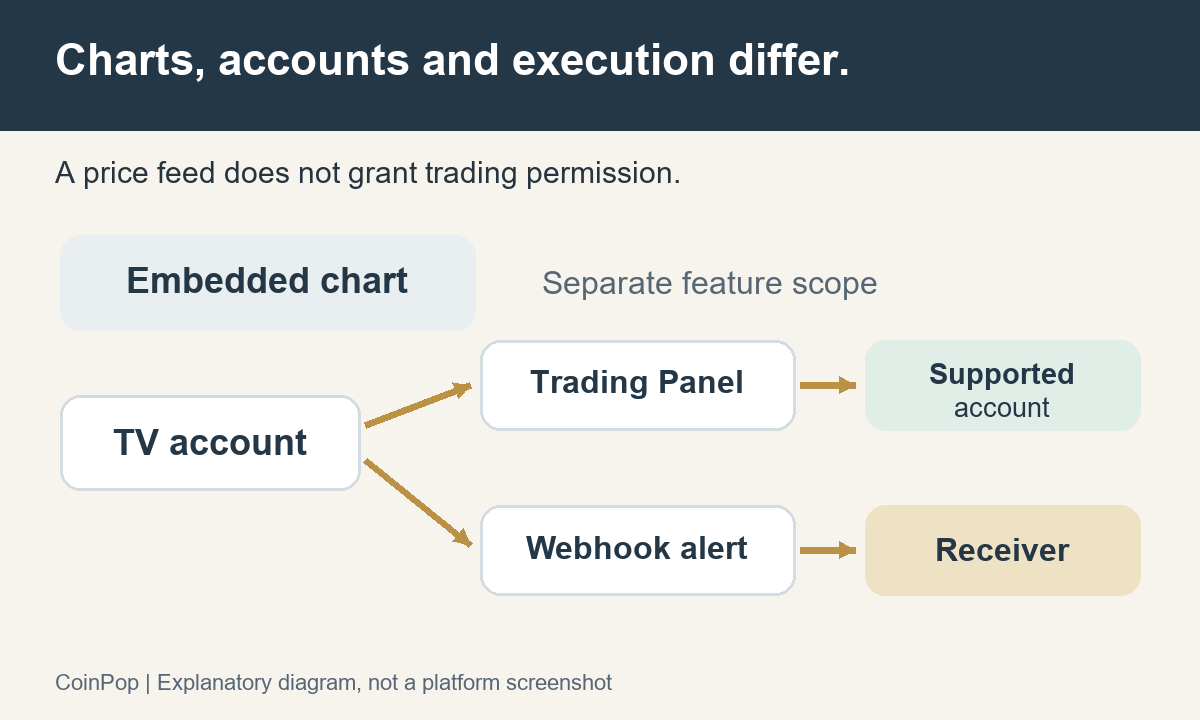
A webhook sends an HTTP request to an external service. Official guidance requires two-step verification and protection of sensitive information, and explains that delivery can fail. Do not include passwords or account credentials in a message. If you do not know what the receiving system does, it is safer not to connect it to automated trading. Official webhook setup and security guidance
The fact that webhooks are available does not mean you have permission to use data for automated orders. TradingView’s and data providers’ terms of use restrict non-display use, so first confirm whether your connection purpose and data use are permitted. Official Data Terms of Use, Section 3
This article does not assume that all exchanges, including Binance, Bybit, and OKX, support direct orders for the same products and in the same way. Check the supported list and the actual permissions for your region and account, and do not circumvent access restrictions.
9. Distinguishing Practice and Backtesting from Live Trading
Separate historical replay, current paper trading, and code-based testing
Use Bar Replay to observe historical charts in sequence, and regular Paper Trading to practice order flows in a simulated account. The Strategy Tester calculates historical results using the rules you write and assumed fills. Even when replaying a historical chart, regular alerts and orders placed through the regular trading panel do not all switch to that historical point in time. Replay Trading is a separate mode from regular Paper Trading. Bar Replay limitations · Guide to historical data trading mode
Write down verification conditions before looking at results
Record the exchange, instrument, timeframe, data period, session, fees, slippage, and fill assumptions. Check whether future information was used in advance, whether values change on an unclosed bar, and whether you selected only periods that produced good results. Separate the period used to set the parameters from the evaluation period, and see whether results also hold up under nearby settings. Official strategy and testing documentation
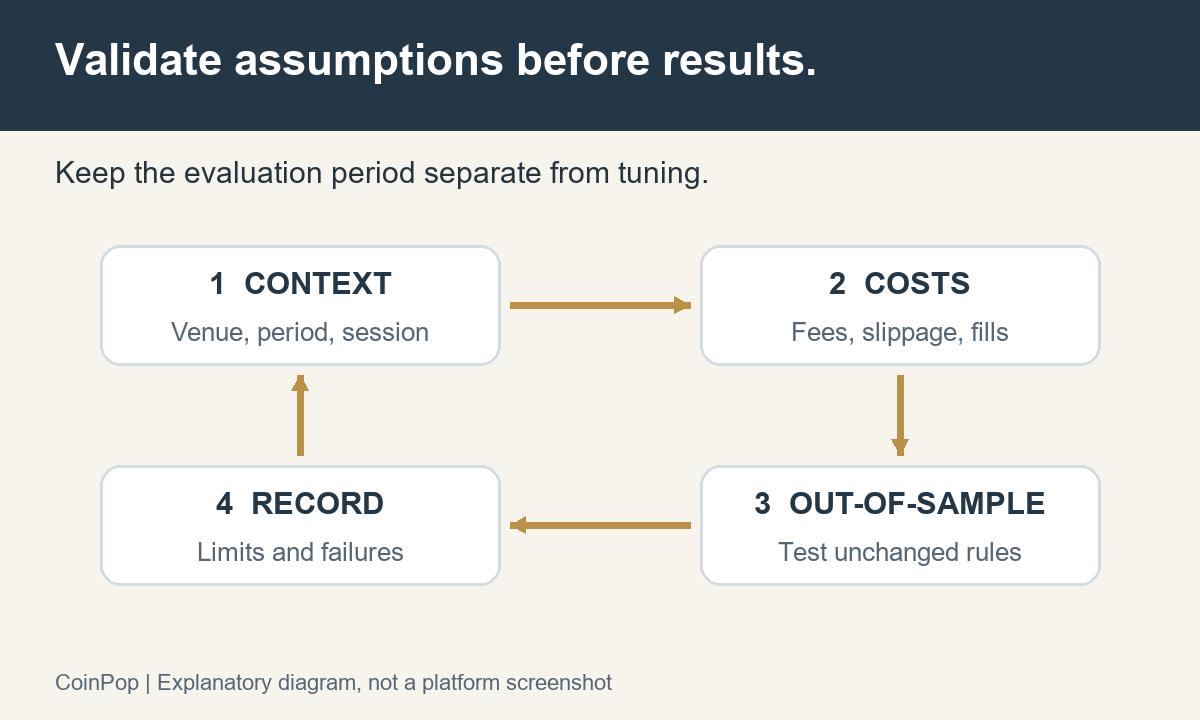
Even if a paid plan gives you access to more historical data, incorrect assumptions will not automatically improve the quality of your testing. Before comparing returns, first confirm that the calculation conditions and omitted costs are the same.
For the first exercise, passing means being able to reproduce your analysis notes
Set your first-day goal not as making a profit, but as “Can I reopen a chart with the same conditions next time?” Choose one symbol, one timeframe, and one indicator, note when you checked them, and write one sentence stating what you observed on the chart. For example, the observation “the line is rising” is different from the prediction “it will rise soon.” Checking whether the conditions match when you open the same layout later makes it easier to catch setup errors.
In the second exercise, keep the observation question fixed and change only the timeframe, recording what changes. The third exercise is to review alert settings using a hypothetical condition and check the symbol, frequency, expiration, and delivery method before creating the alert. If you actually create an alert, manage whether to pause or delete it when its purpose has ended. You do not need to connect a real trading account or an external automation service for practice.
For backtest cost examples, first check the input values and units
Assume a hypothetical round-trip trade with a notional amount of 1,000 USD for both entry and exit, and a fee of 0.1% each for buying and selling. The fees are 1 USD + 1 USD = 2 USD. The calculation of 0.2% of 1,000 USD holds only under the simple assumption that the notional amount is the same on both sides. Actual costs vary with price, quantity, contract method, and fee tier. Funding fees or borrowing interest for futures, bid-ask spreads, and slippage are not included in this example.
If you entered costs in the Strategy Tester, select one trade and manually reconcile the calculation details. Do not overlook unit errors just because the total net profit figure looks good; distinguish percentages from fixed amounts, and contract quantities from notional amounts. Examine losing periods and periods with few trades as well as favorable ones, and record whether the sample size is sufficient when changing the period. This is a method for checking the tool’s calculations; it does not mean that a profitable strategy has been fully validated.
In your reproducibility notes, include the data period, symbol, timeframe, session, code version, inputs, fee and slippage assumptions, and unchecked items. This will help you identify which input changed if results differ. A case where a particular indicator was right a few times recently is not as strong a basis as results validated across multiple market conditions with costs included. Before committing real money, first understand the difference between values calculated by the tool and actual trades.
10. Related Articles, FAQ, and Pre-Start Checklist
Continue reading guides suited to your purpose
This pillar article is a starting point for chart tools, while the existing guide to RSI, Bollinger Bands, and Moving Averages covers the interpretation of individual indicators. Order flow is covered in the previously linked Bybit futures guide, price comparisons across markets in the Kimchi Premium page, and company analysis in the Tesla earnings and valuation analysis. Each article serves a different purpose, so reading about how to use the tools does not mean you need to proceed with an actual trade.
To learn more about Pine Script, alerts, and backtesting, you can continue with the official TradingView documentation linked in each subsection. After learning the basic controls, read according to the questions you need answered now, such as indicator code, alert conditions, or validation costs. Before connecting a feature to actual orders, separately verify its scope of support and how to respond if it fails.
U.S. stock charts and earnings analysis also serve different purposes. When reading articles that examine the relationship between a business and its share price, such as Tesla delivery volumes, earnings, and company valuation analysis, charts are supplementary materials. Checking the source of chart data cannot substitute for reviewing a company's valuation.
Do I need a paid plan from the start?
No. Start for free with tasks such as viewing basic charts and a small number of indicators, and compare the least expensive plan only if you find that you actually need features that are unavailable.
Does a paid subscription include all real-time market data?
No. Data for some stock and futures exchanges may require separate entitlements or fees. Check the data provider for the instrument, any delay indicators, and the requirements for the exchange data you need.
If an exchange has a chart that looks the same, does a separate subscription apply?
An embedded chart and a separate account do not guarantee the same range of services. Check separately whether subscription features, login, layouts, alerts, and direct order placement are connected.
Does creating an alert enable automated trading?
An alert alone does not submit an order. Direct trading integration or an external receiving system may also be needed, and support, permissions, security, and delivery failures should be reviewed separately.
Which plan should I choose?
There is no reason to choose the most expensive plan by default. List the concurrent charts, indicators, alerts, and validation features you need, then compare the total cost and actual limits before deciding.
Can I also view KRW charts for Upbit and Bithumb?
The symbol search we checked included UPBIT:BTCKRW and BITHUMB:BTCKRW. Even for the same coin, the exchange, spot or futures market, and display currency may differ, so review the provider shown in the search results. See Korean market examples for the comparison sequence and conversion assumptions.
Are fees charged in KRW?
The web pricing table checked for this article displayed prices in USD. We could not verify whether KRW billing is supported, so we do not promise that it is. Check the currency and final total shown on the payment screen, along with taxes and the payment method's conversion terms. A Korean-language interface does not necessarily mean payment in KRW.
- I checked that the instrument, exchange, product, and timeframe I am viewing are correct.
- I first tried completing the task within the free limits.
- I distinguished between the paid features I need and separate data entitlements.
- I read the monthly charge, annual total, taxes, renewal, and cancellation terms.
- I do not treat alerts, webhooks, orders, and executions as the same status.
- I record validation conditions and limitations and do not expect settings that guarantee profits.
This article does not pressure readers to subscribe and does not provide individualized investment advice, real-time trading signals, or guaranteed returns.
Sources and scope of verification
The information was checked on October 26, 2026. We compared the official Korean-language website's pricing and feature tables with the PC symbol search, tools, and alert settings windows. Descriptions of alerts, market data, Pine Script, and replay tools were compiled based on the official documentation linked in each subsection.
We did not verify actual payments, tax charges, affiliate tracking attribution, alert creation, triggering, or receipt, mobile devices in use or push notification receipt, execution or saving of synthetic-symbol charts, external webhook delivery, orders, executions, or the real-time performance of specific code. Existing layouts, alerts, and orders were not changed. The explanatory images are diagrams created by Coinpop and are not official screens or official materials.
You can find information about editorial responsibility and correction inquiries at About Coinpop and Editorial Responsibility (English). If terms change or an error is confirmed, we will update the relevant evidence and verification date together.