
The investment value of NVIDIA stock depends not only on AI revenue growth, but also on whether that revenue is collected in cash, whether the returns to shareholders are increasing, and how much growth is already reflected in the share price. Recent filings confirm strong growth and cash generation, but a large share repurchase authorization and customer financing support differ in their nature and terms. This article examines NVIDIA common stock (NASDAQ: NVDA), compares its earnings, cash flow, and capital allocation, and presents the assumptions needed for an investment decision in calculation tables.
Data last verified: October 13, 2026 (KST) · Written and edited by: CoinPop. Earnings are based on the second quarter of fiscal 2027, ended July 26, 2026, and the half-year figures cover the six months ended on the same date. Fiscal-year labels are distinguished from calendar years to avoid confusion. The share price and earnings assumptions used in the enterprise value calculations below are illustrative; they are not current market prices, company forecasts, or price targets.
Four figures NVIDIA investors should distinguish first
Revenue, repurchase authorization amounts, guarantee limits, and external financing targets are all stated in dollars. However, they cannot be added together and treated as company revenue or spending. First, distinguish whether a figure represents actual results, available authorization, a contingent obligation, or a future financing target.
| Announcement / data date | What was confirmed | What investors should take it to mean |
|---|---|---|
| August 10, 2026 | Plan to mobilize more than $500 billion in third-party capital through an AI infrastructure financing platform | A plan requiring final agreements. It is not NVIDIA spending or confirmed revenue. |
| August 26, 2026 | Second-quarter revenue of $96.221 billion, up 106% year over year | Results for the quarter ended July 26. Distinguish them from results after the announcement date. |
| Form 10-Q filed August 27, 2026 | Disclosure of guarantees of up to $105 billion related to SB Energy, entered into in August | A guarantee limit that may trigger payment obligations under specified conditions. It is not cash already spent. |
| September 28, 2026 | Additional $150 billion in share repurchase authorization, with $235 billion remaining | Separate from actual repurchase activity. The company expects to execute the authorization through fiscal 2028. |
Sources: official financing platform announcement, quarterly earnings release, 10-Q guarantee terms, share repurchase authorization announcement. This is an analysis connecting the disclosures, not breaking news published on the day of an announcement.
Earnings quality matters as much as AI revenue growth
Revenue is the amount recognized under accounting standards for products and services provided to customers. Operating income reflects cost of revenue and operating expenses, while operating cash flow also reflects the timing of collections and payments. Checking whether all three figures are improving together can provide a more concrete assessment of the scale and sustainability of growth.
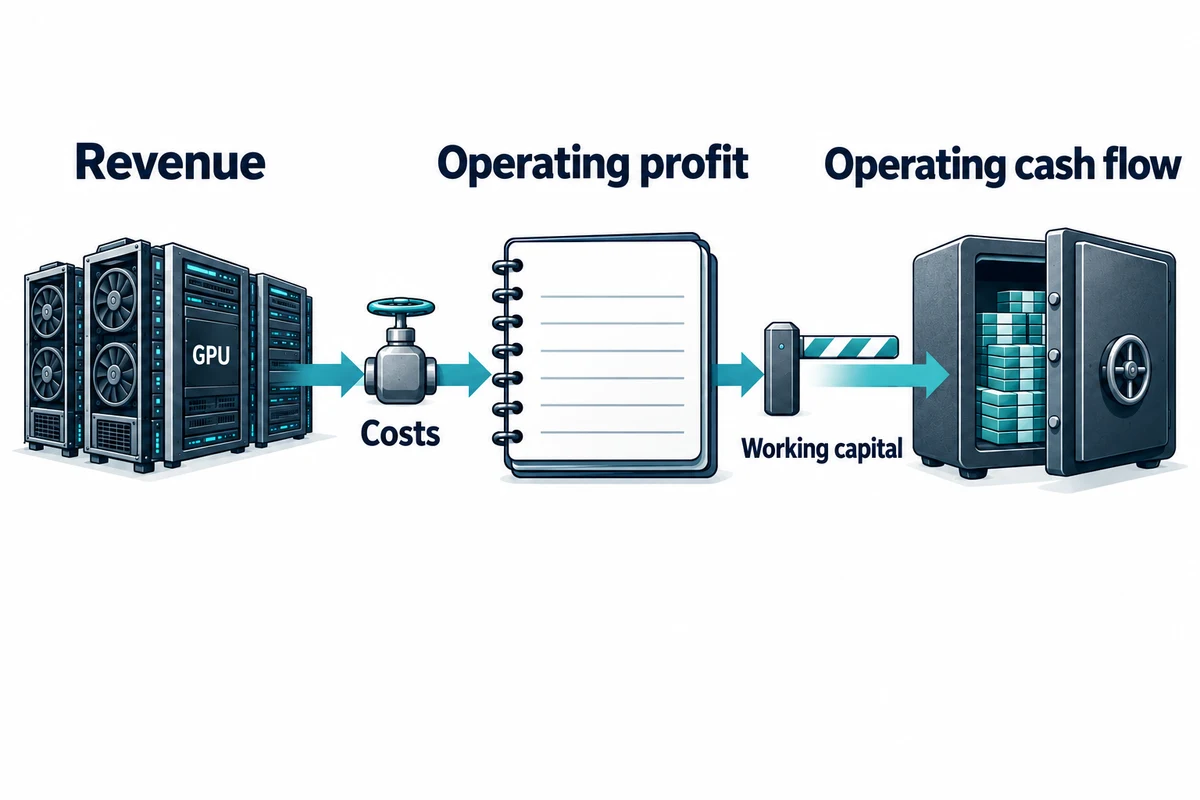
The amounts in the table below are in USD billions. One billion dollars is $1 billion, and EPS is stated in dollars per share.
| Metric | Second quarter of fiscal 2027 | How to interpret |
|---|---|---|
| Revenue | 96.221 | Up 18% quarter over quarter and 106% year over year |
| Data center revenue | 89.0 | A key business metric for AI infrastructure demand |
| GAAP operating income | 63.734 | Distinguish from net income, which includes gains and losses on investments |
| GAAP net income | 59.688 | Includes non-operating income and expenses and taxes |
| Diluted EPS | GAAP: 2.46 / adjusted: 2.22 | Different definitions of earnings, even for the same quarter |
Source: NVIDIA fiscal 2027 second-quarter results and reconciliation. GAAP refers to U.S. generally accepted accounting principles; adjusted results (non-GAAP) are supplemental metrics for which the company adjusts certain items.
Why is GAAP EPS higher than adjusted EPS?
Gains related to investments and other items can increase GAAP net income but may be excluded from adjusted results. Therefore, when comparing the two EPS figures for this quarter, investors should set aside the assumption that “adjusted earnings are always higher” and review the company's reconciliation. NVIDIA specifically stated that, beginning in fiscal 2027, it will no longer exclude stock-based compensation expense from adjusted results, and that it revised prior-year comparative figures accordingly.
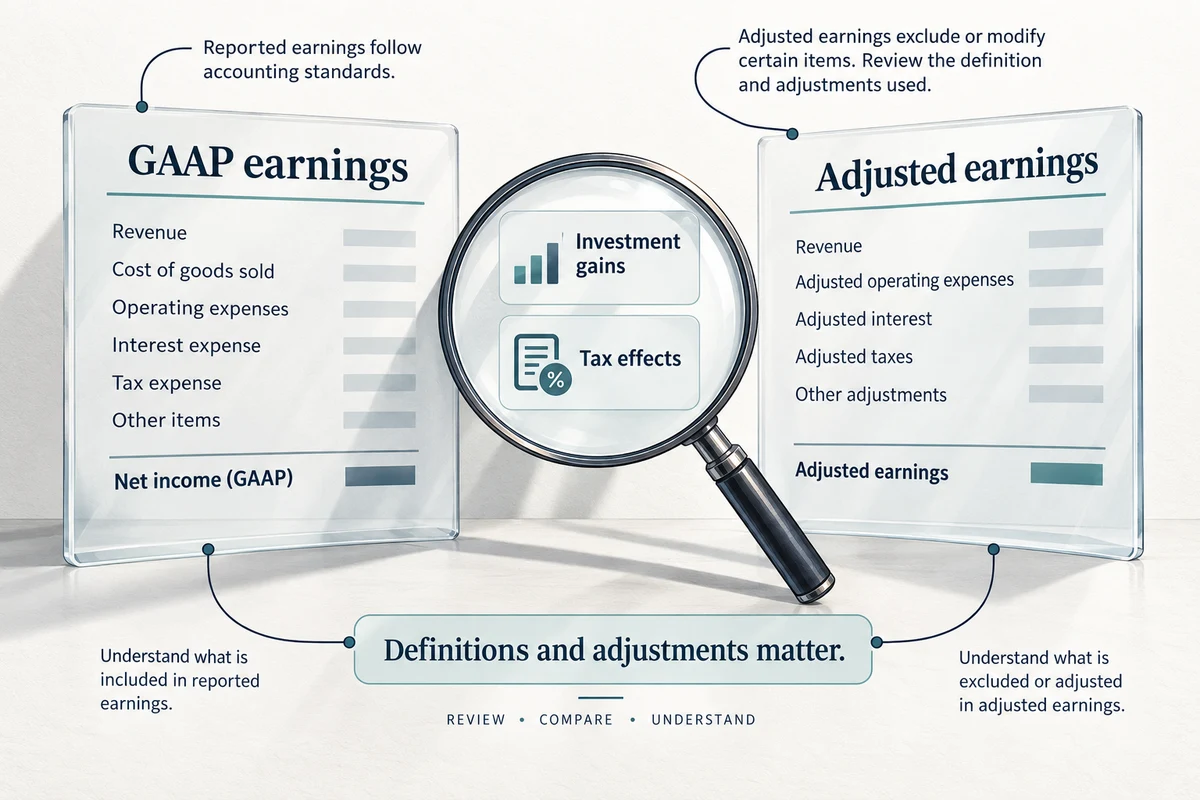
CoinPop analysis: When assessing demand for AI products, it is useful to look first at revenue and operating income, then separate the increase in net income into operating performance and gains or losses on investments. Simply multiplying one quarter's EPS by four and treating it as guaranteed earnings for the next year could overlook changes in growth rates, taxes, and investment gains and losses.
Even when net income is high, cash moves differently
Cash flow is an important cross-check for investment decisions. If products have been sold but payment has not yet been collected, or inventory is acquired in advance for future sales, the timing of earnings and cash inflows will differ. Conversely, noncash investment gains can increase net income, but that does not mean an equivalent amount of operating cash has come in.
| Half-year cash flow items | USD billions | Interpretation |
|---|---|---|
| Cash flow from operating activities | 74.421 | Starting point for cash generation over the same half-year period |
| Cash purchases of property, plant, equipment, and intangible assets | 4.434 | Deducted in the FCF calculation below |
| Principal payments related to property, plant, equipment, and intangible assets | 0.092 | Additional deduction depending on the company's definition of FCF |
| Free cash flow calculated using the definition above | 69.895 | 74.421 − 4.434 − 0.092 |
| Cash paid for share repurchases | 39.044 | Actual payments in the cash flow statement, not the authorized amount |
| Dividends paid | 6.290 | Actual payments over the same half-year period |
Source: 10-Q statement of cash flows, printed page 8. All figures cover the six months ended July 26, 2026. FCF is recalculated by CoinPop using the company's definition and reported inputs. Subtracting only asset purchases from operating cash flow gives $69.987 billion, a difference of $0.092 billion from the company's definition.
FCF is not the cash balance or the amount left after all investments have been made. Equity investments, acquisitions, debt financing, and repayments should be considered separately. Therefore, simply calling the amount remaining after deducting share repurchases and dividends from FCF “cash available for free use” overlooks the company's overall cash flows.
The same filing also shows cash deductions from increases in accounts receivable and inventory. These movements can occur during growth, so an increase alone cannot be taken as evidence of financial distress. In the next quarter, alongside revenue growth, check collection terms, changes in accounts receivable, customer concentration, and whether additional provisions were recorded.
For share repurchases, execution price and net share count matter more than the authorized amount
The $150 billion announced on September 28, 2026, is an amount authorizing additional repurchases. At the time of the announcement, $235 billion in total authorization remained, and the company said it expected to execute it through fiscal 2028. This does not mean the entire amount was spent on the announcement date, nor does it guarantee a floor for the share price.
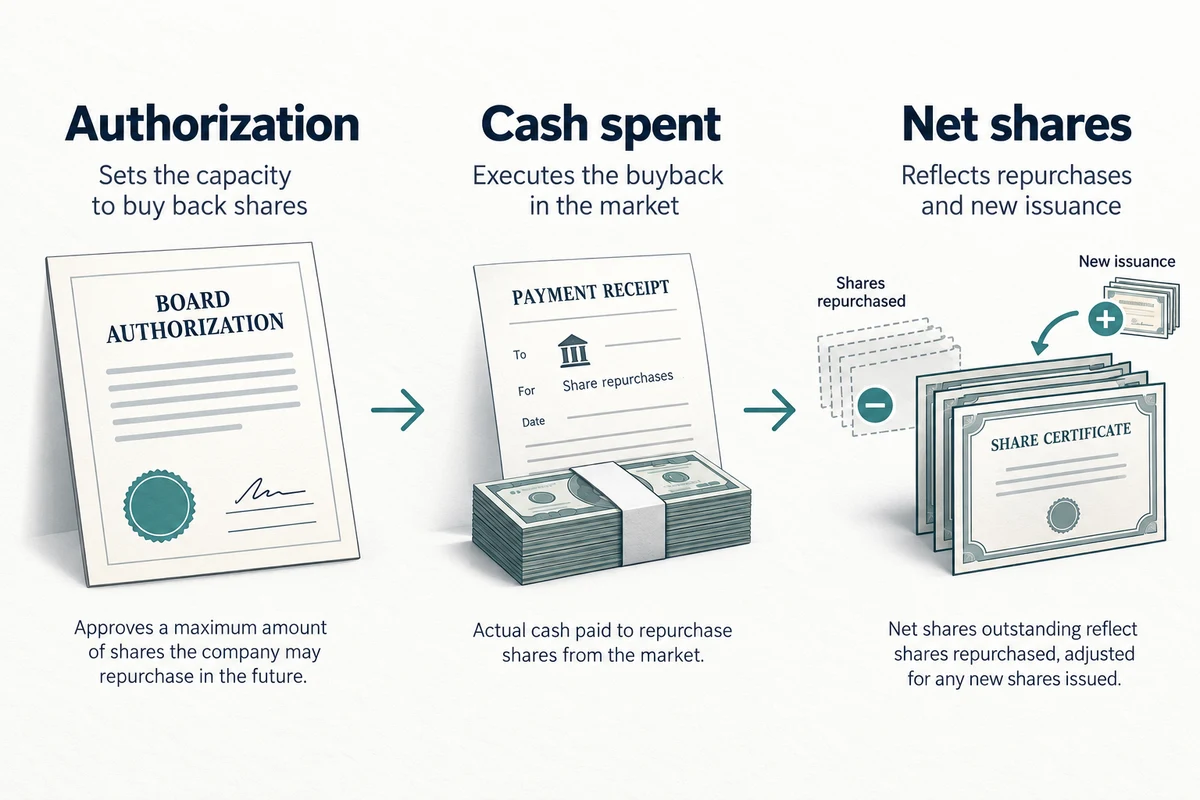
The difference becomes clear when you calculate the change in shares outstanding directly. Based on the 10-Q’s six-month statement of changes in equity, all quantities below are in million shares.
Beginning balance 24,304 + new shares issued 69 − tax withholding related to stock-based compensation 23 − share repurchases 203 = ending balance 24,147 million shares. The net decrease was 157 million shares, or about 0.65% of the beginning balance. The calculation is 157 ÷ 24,304 × 100. This is the change in shares outstanding at period-end and should be distinguished from the period-average diluted share count used to calculate EPS.
Sources: the 10-Q’s six-month statement of changes in equity and the September 28 share repurchase announcement. The six-month-end data and the September authorization have different as-of dates, so they should not be simply added together or used to estimate the difference as the actual cash spent.
CoinPop Analysis: If earnings are unchanged, a reduction in the number of shares can boost earnings per share. However, buying shares at a high price means fewer shares can be retired with the same amount of cash. Long-term shareholders should consider not only the size of the authorization but also the actual average repurchase price, new shares issued through stock-based compensation, and the balance with funding for research and development and investment.
Customer financing broadens AI demand but also creates new risks
AI cloud customers need funding for data centers, power, and construction in addition to GPU purchases. Connecting them with external capital can accelerate infrastructure development, but financial burdens may grow if revenue from computing services paid by end users is insufficient. This is why hardware sales and customer financing need to be considered together.
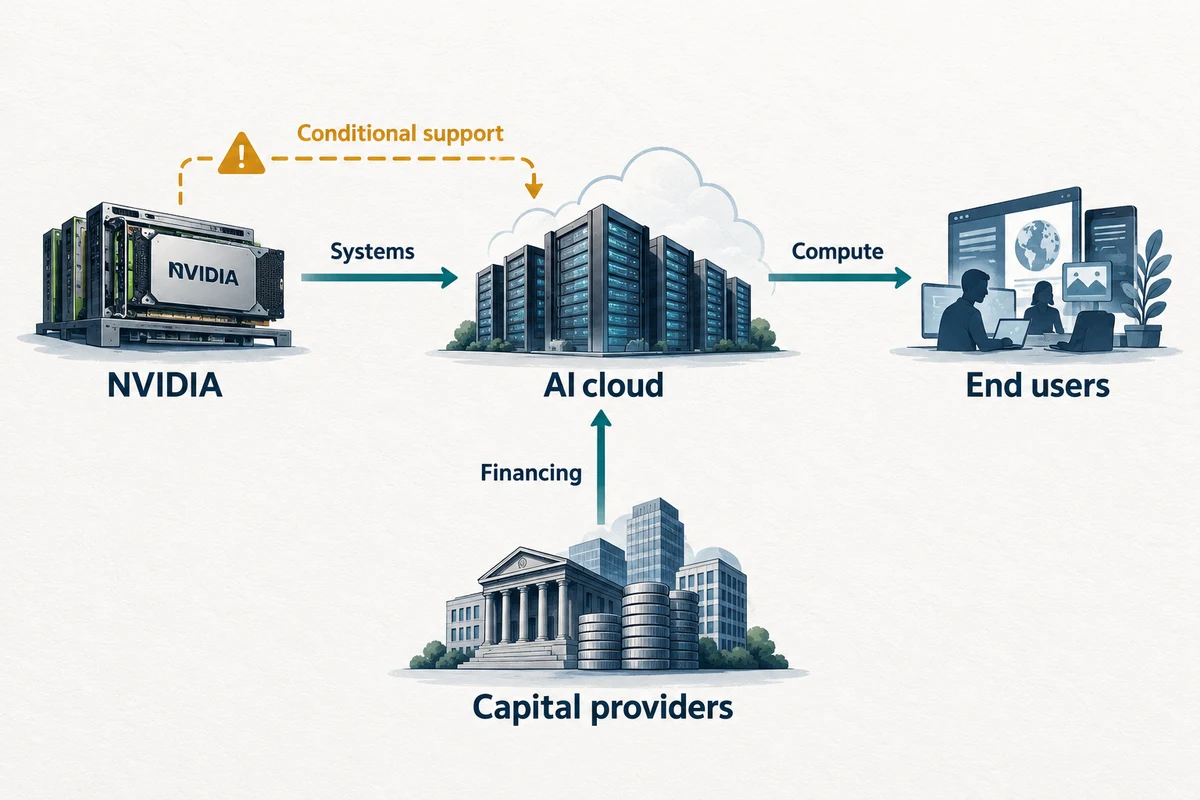
How do the $500 billion fundraising plan and $105 billion guarantee differ?
The August 10 announcement outlined a plan to establish an independent computing finance platform with financial firms and, over time, mobilize more than $500 billion in third-party capital. This is subject to the execution of final agreements. This amount should not be treated as cash directly invested by NVIDIA or as revenue already secured. Original official announcement.
Separately, the 10-Q lists a maximum aggregate exposure of $105 billion for guarantees related to SB Energy entered into in August. The guarantees are tied to phased projects totaling approximately 4.25 GW, with the first phase expected to begin in fiscal 2029. A payment obligation would arise in the event of a specified tenant default, applies to certain rent and power payment amounts, and is subject to conditions for reduction and termination. The maximum limit does not represent a current loss amount or the probability of a loss occurring. 10-Q guarantee terms, printed page 19.
CoinPop Analysis: The positive path is external financing → infrastructure completion → expanded service use → customer cash recovery → reinvestment. The path toward greater burdens is construction or power connection delays, or low utilization → customer cash shortfalls → need for additional financing → increased conditional support burden. Which path materializes must be assessed using actual deployment, utilization, and cash recovery data, not the total contract value.
Even if NVIDIA maintains its technological competitiveness, customer financing costs may be affected by market interest rates. For background, see How to Read FOMC Rate Decisions and Dollar Liquidity; for an interpretation of inflation releases, see Distinguishing U.S. CPI and PCE Indicators. A single macroeconomic indicator cannot predict an individual company’s results or share price.
How to calculate whether NVIDIA stock is worth investing in
The growth and cash generation confirmed by current filings provide grounds for continued analysis. However, if a high level of earnings growth is already reflected in the purchase price, strong business performance may not translate into strong investment returns. This article does not provide a current P/E ratio or conclude that the stock is “undervalued now,” because we could not obtain a share price with a matching verification timestamp.

The following table shows the results of assumed annual EPS × assumed P/E. EPS values of $6, $8, and $10 and P/E ratios of 20, 30, and 40 are arbitrary inputs chosen to illustrate the calculation. They are not company guidance, analyst consensus, a fair purchase price, or a price target.
| Assumed annual EPS | P/E of 20 | P/E of 30 | P/E of 40 |
|---|---|---|---|
| $6 | $120 | $180 | $240 |
| $8 | $160 | $240 | $320 |
| $10 | $200 | $300 | $400 |
Worked example: EPS of $8 × a P/E of 30 = $240. Even if EPS rises 25% from $8 to $10, the calculated value falls about 16.7%, from $240 to $200, if the market-applied P/E declines from 30 to 20. This is a mathematical example showing that earnings growth and share price increases do not always move in the same direction. Transaction costs, dividends, taxes, and exchange rates are not included.
To apply this directly, use a share price with a timestamp shown by your brokerage and EPS with a clear source and period, calculated on the same basis. Do not mix trailing 12-month EPS with estimated forward 12-month EPS, and use consistent GAAP or adjusted figures. If a price depends on the assumption that growth and margins will remain high, it is also advisable to calculate what happens if that assumption proves incorrect.
What should you look for in optimistic, neutral, and risk scenarios?
| Conditional scenario | Assumptions to verify | Signals that weaken the thesis |
|---|---|---|
| If growth continues | Product demand, margins, and cash recovery all hold up, and customer investment translates into actual operations | Revenue grows, but cash collection or utilization is not subsequently confirmed |
| If the business grows but expectations are adjusted | Earnings increase, but growth slows or a lower P/E is applied | Focusing only on the earnings growth rate and ignoring the burden of a high price |
| If financing and supply risks increase | Customer financing, power, or construction delays; export restrictions; or competitive pressure emerge | Cash recovery worsens while the burden of additional support rises |
The scenarios above are CoinPop’s conditional analyses and do not assert the probability of occurrence or the direction of the share price. Risks disclosed by the company, including supply chain, export controls, and competition, should be reviewed together with 10-Q risk factors.
Investors should ask different questions based on their investor profile
- Long-term growth investors: Check the evidence that expanding AI demand will translate into per-share cash generation over several years, and assess the response to competitors and customers’ in-house chip designs.
- Investors already heavily weighted toward technology stocks: Regardless of the appeal of an individual stock, calculate concentration while accounting for indirect holdings through indexes and funds.
- People investing money they will need in the short term: First consider that a company’s long-term growth may not align with its share price at the time the money is needed.
- Investors who track returns in Korean won: Consider both the return on the share price in U.S. dollars and the effect of the dollar-won exchange rate. Before taxes and fees, if the share price rises 10% and the dollar’s value in won falls 5%, the return in won is 1.10 × 0.95 − 1 = 4.5%.
The practice of separating current results from expectations for future business in growth companies can also be applied to Analyzing Tesla’s Deliveries, Results, and Valuation. Because the business models differ, avoid simply comparing the two companies’ P/E ratios.
Six things to check in the next earnings release
- Company outlook and actual results: The revenue outlook for the following quarter, announced in August, was $108 billion ±2%, or $105.84 billion–$110.16 billion by calculation. This is guidance and assumes no data center compute revenue from China.
- Margins: Check whether revenue growth translates into operating income after costs, research and development, and selling expenses.
- Cash recovery: Compare operating cash flow, accounts receivable, and payment terms for the same period.
- Per-share impact: Check actual share repurchases, new shares issued, and the period-average diluted share count.
- Customer financing: Distinguish between the stages of planning, final agreements, construction start, operation, and cash collection, and verify the actual commencement and any changes to guarantee terms.
- Expectations reflected in the price: Recalculate valuation assumptions using an EPS basis that reflects the new results and a matching share price timestamp.
The source for the outlook figures is the Outlook section of the company’s earnings release. Once actual results are available, compare them in a separate column against the outlook; do not fill in results that have not yet been announced.
Frequently asked questions
Can NVIDIA’s share price fall even when its earnings are strong?
That is possible. The share price already reflects expected results along with future growth, risk, and discount rates. Even if earnings increase, the share price may fall if results fall short of expectations or the applicable P/E multiple declines. The EPS and P/E calculations in the article are examples illustrating this relationship.
Has the full $150 billion in share repurchases been executed?
The figure announced on September 28 was an additional authorization. Actual execution should be verified through repurchase details in subsequent filings and the cash flow statement. An authorization announcement alone does not establish that the repurchases have been completed or that the share price will rise.
Is the $105 billion in customer guarantees a current liability or a confirmed loss?
This is the maximum amount of contingent exposure disclosed in the filing. There are conditions that trigger payment, phased commencement, and limits on coverage and termination. It would be inaccurate to treat the entire maximum amount as money already paid or as a confirmed loss.
Should I look at only one of GAAP EPS and adjusted EPS?
It is appropriate to consider both figures along with the reconciliation. What matters is which items account for the difference and whether past periods are being compared using the same definitions. Adjusted results do not replace official reported financial results.
Is the $240 in this article NVIDIA’s price target?
No. It is an educational calculation multiplying an arbitrary annual EPS of $8 by a P/E multiple of 30. It does not represent the current share price or a fair purchase price, nor is it a forecast of future results.
Can the same analysis be applied to NVDA common stock and leveraged products?
This article focuses on NVIDIA common stock. Leveraged and inverse products have their own tracking methods, costs, and risks, so you should also review their prospectuses. An analysis of the company’s results alone cannot explain the returns of these products.
Analysis criteria, sources, and conflicts of interest
Company figures were verified against NVIDIA investor relations materials and its Form 10-Q. The article distinguishes disclosed facts, company outlook and plans, and CoinPop’s calculations and analysis. Intraday prices, the current P/E ratio, and suitability for individual investors are outside the scope of what this article verifies or assesses.
- NVIDIA Fiscal 2027 Second-Quarter Results Announcement — August 26, 2026.
- NVIDIA Fiscal 2027 Second-Quarter Form 10-Q — filed August 27, 2026. Capital changes, cash flows, guarantees, and risk factors reviewed.
- Announcement of Expanded Share Repurchase Authorization — September 28, 2026.
- Announcement of AI Computing Infrastructure Financing Platform — August 10, 2026.
This article contains no brokerage sign-up affiliate links or calls to action encouraging trades in specific stocks. It is an analysis for general informational and educational purposes and is not an investment recommendation tailored to an individual’s assets, goals, or risk tolerance. Stocks can result in a loss of principal, and international stocks are also affected by exchange rates. The illustrative image is a conceptual diagram created and reviewed by CoinPop using AI; it is not an actual company document or evidence of investment performance. If you find an error, please contact CoinPop and provide the relevant sentence and supporting evidence.