
COINPOP · Digital Asset Research & Tools
Read Bitcoin’s movements,
and compare on your terms.
Calculate costs yourself, and make decisions based on evidence.
From exchange comparisons to account security and market analysis.

Compare Under the Same ConditionsDistinguish the scope of markets, currencies, and rates
Show Sources and TimestampsSeparate the original data basis from collection times
Include the Limits of Each AssessmentLower costs do not mean higher safety
TOOLS FOR YOUR NEXT QUESTION
Tools for Your Next Question
Average Cost · Break-Even · Profit and Loss ↗
Enter your purchase history and fees to calculate your trade benchmarks.
02 / MARKETDomestic and International Prices · Market Sentiment ↗
Check Upbit, Bithumb, and 4 overseas exchanges in KRW and USDT.
03 / SOURCESFinancial Policies · Official Announcements ↗
Check the titles, sources, and publication times of official Fed and SEC announcements.
THE ESSENTIAL GUIDES
Go Deeper from the Start with Essential Guides
COINPOP JOURNAL
Latest Content
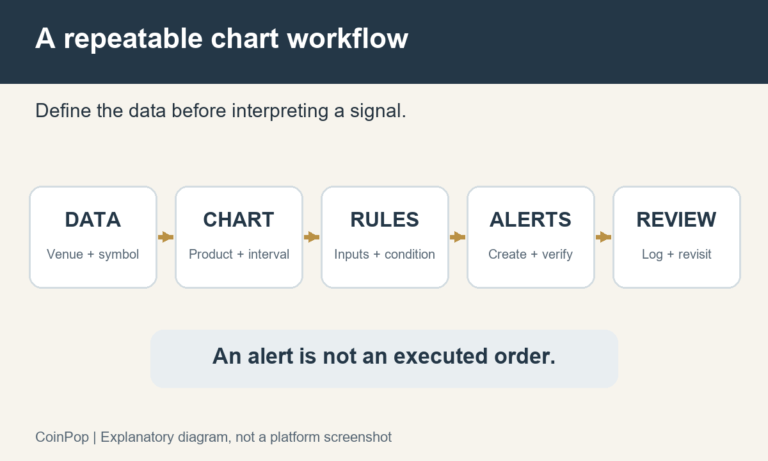
How to Use TradingView: A Guide to Getting Started for Free, Charts, Alerts, and Choosing a Plan
For readers new to TradingView, this guide covers chart setup, choosing free or paid plans, differences in alerts and exchange integration, data costs, and verification methods.
Read the Analysis ↗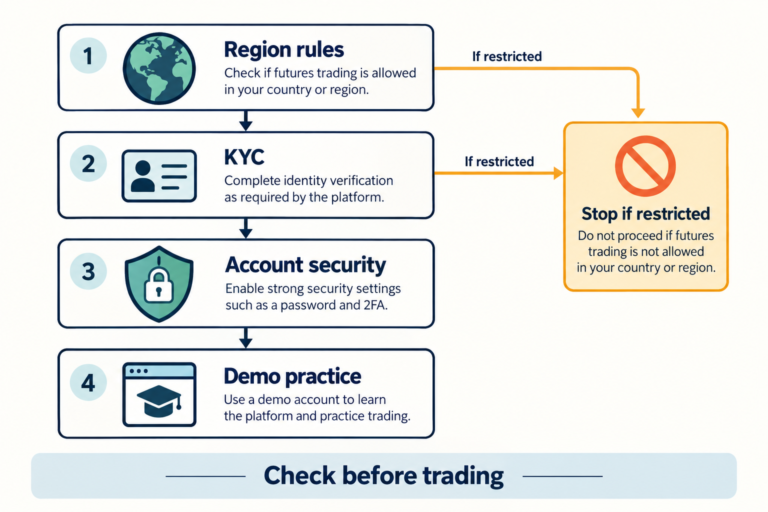
How to Trade Bybit Futures: A Guide to Orders, Stop-Losses, and Checking Position Closure
A practical guide to distinguishing order quantity, margin, and costs in Bybit USDT perpetual futures, and checking unfilled or partially filled orders, take-profit and stop-loss orders, position closure, and remaining orders.
Read the Analysis ↗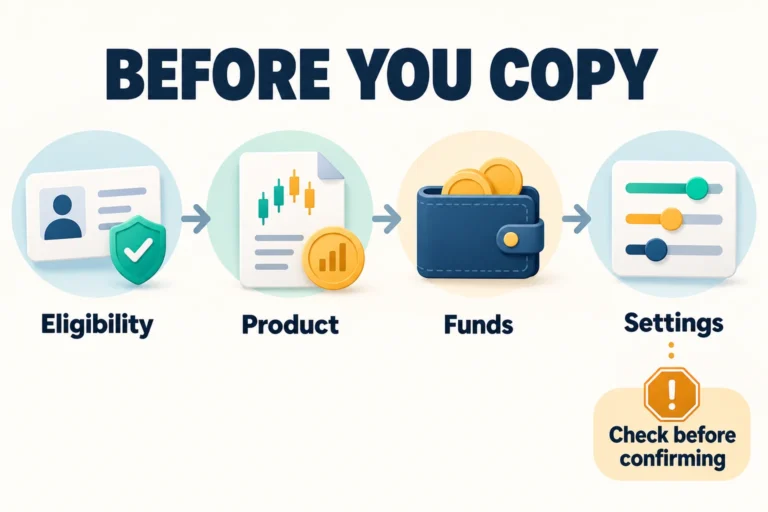
How to Copy Trade on Bybit: Initial Setup, Loss Limits, and Stopping
A step-by-step guide to the eligibility requirements, copy modes, verifying normal operation, troubleshooting failures, PCSL, profit sharing, and checking your balance after stopping when first reviewing Copy Trading Classic.
Read the Analysis ↗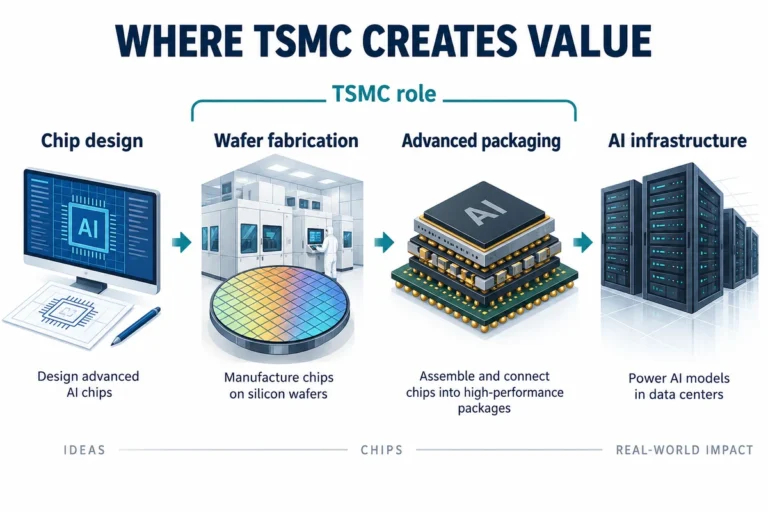
TSMC Stock Forecast: Investment Value Based on 3 Quarterly Results, 2-Nanometer Technology, and Cash Flow
We analyze TSMC's growth and profit margins separately from the cash remaining after capital expenditures. Using a reproducible EPS and P/E calculation table, we examine the conditions supporting investment value and the counterarguments, including the differences between common stock and U.S. ADRs.
Read the Analysis ↗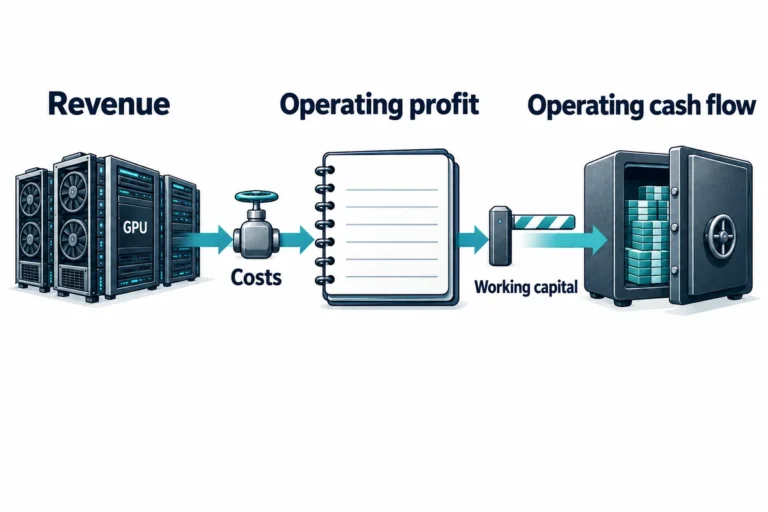
NVIDIA Stock Analysis: AI Results, Share Buybacks, and Customer Financing Support
We compare NVIDIA's revenue growth with its cash generation and distinguish the terms of share buybacks from those of customer financing support. Official filings and an EPS and P/E calculation table help assess the assumptions and risks involved in making an investment decision.
Read the Analysis ↗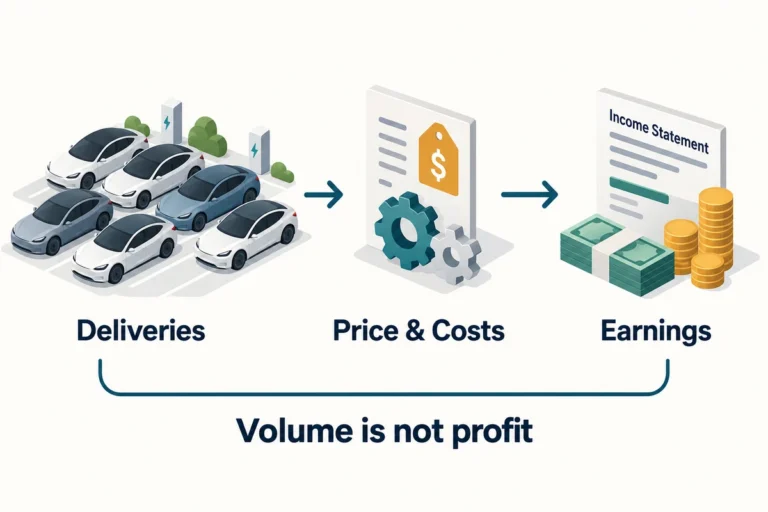
Tesla Stock: Is It Worth Investing in Now? Analysis of Deliveries, Results, and Valuation
We compare Tesla's 3 quarterly vehicle deliveries and energy installations with market expectations and year-ago figures, and distinguish investment appeal from risk using GAAP earnings, cash flow, and pricing assumptions.
Read the Analysis ↗RESEARCH WITH CONTEXT
Verify with tools,
understand with analysis.
We do not draw conclusions from a single figure or ranking. We connect official sources, comparison criteria, and calculation assumptions so they can be reviewed together.
Coinpop Editorial Policy ↗SEC Adopts Amendments to Update Definitions of Small Entity for Investment Companies and Investment Advisers
View announcement list →COMPARE THE SAME CONDITIONS
Fee Comparison
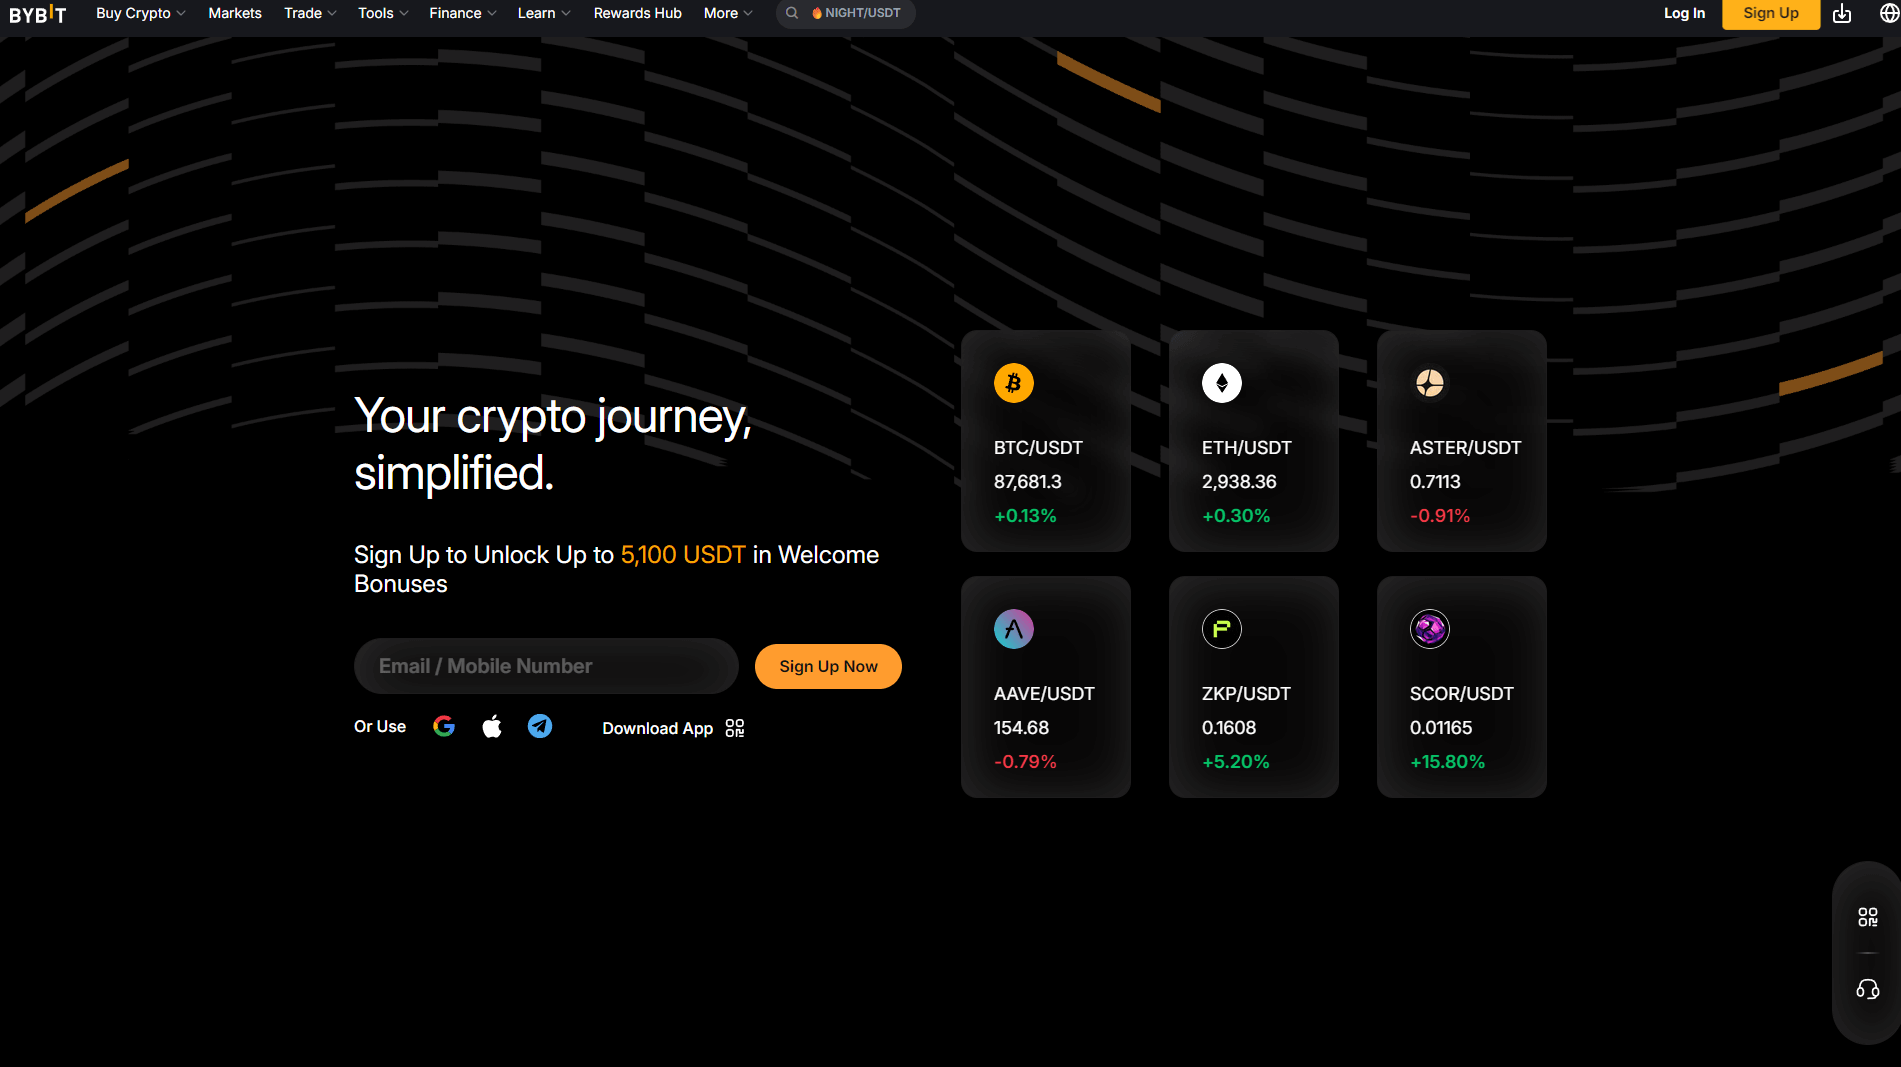
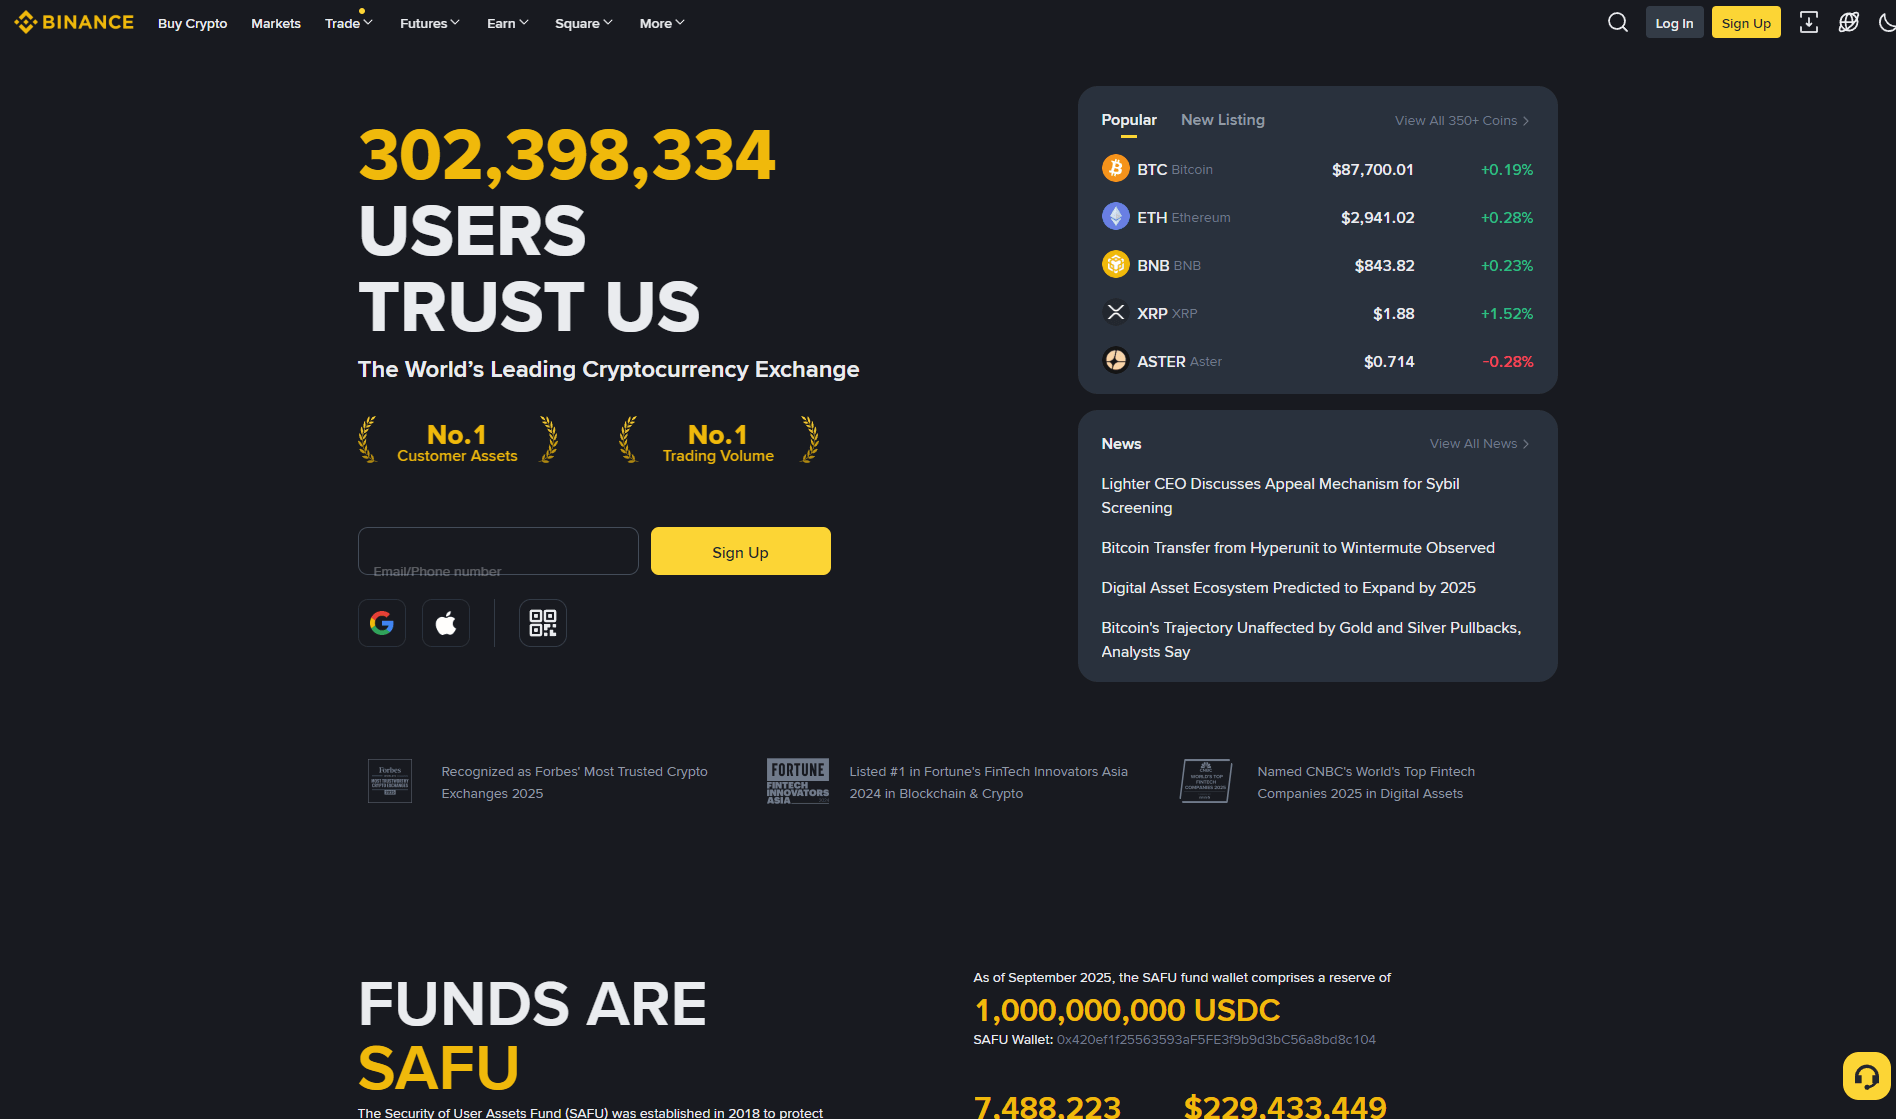
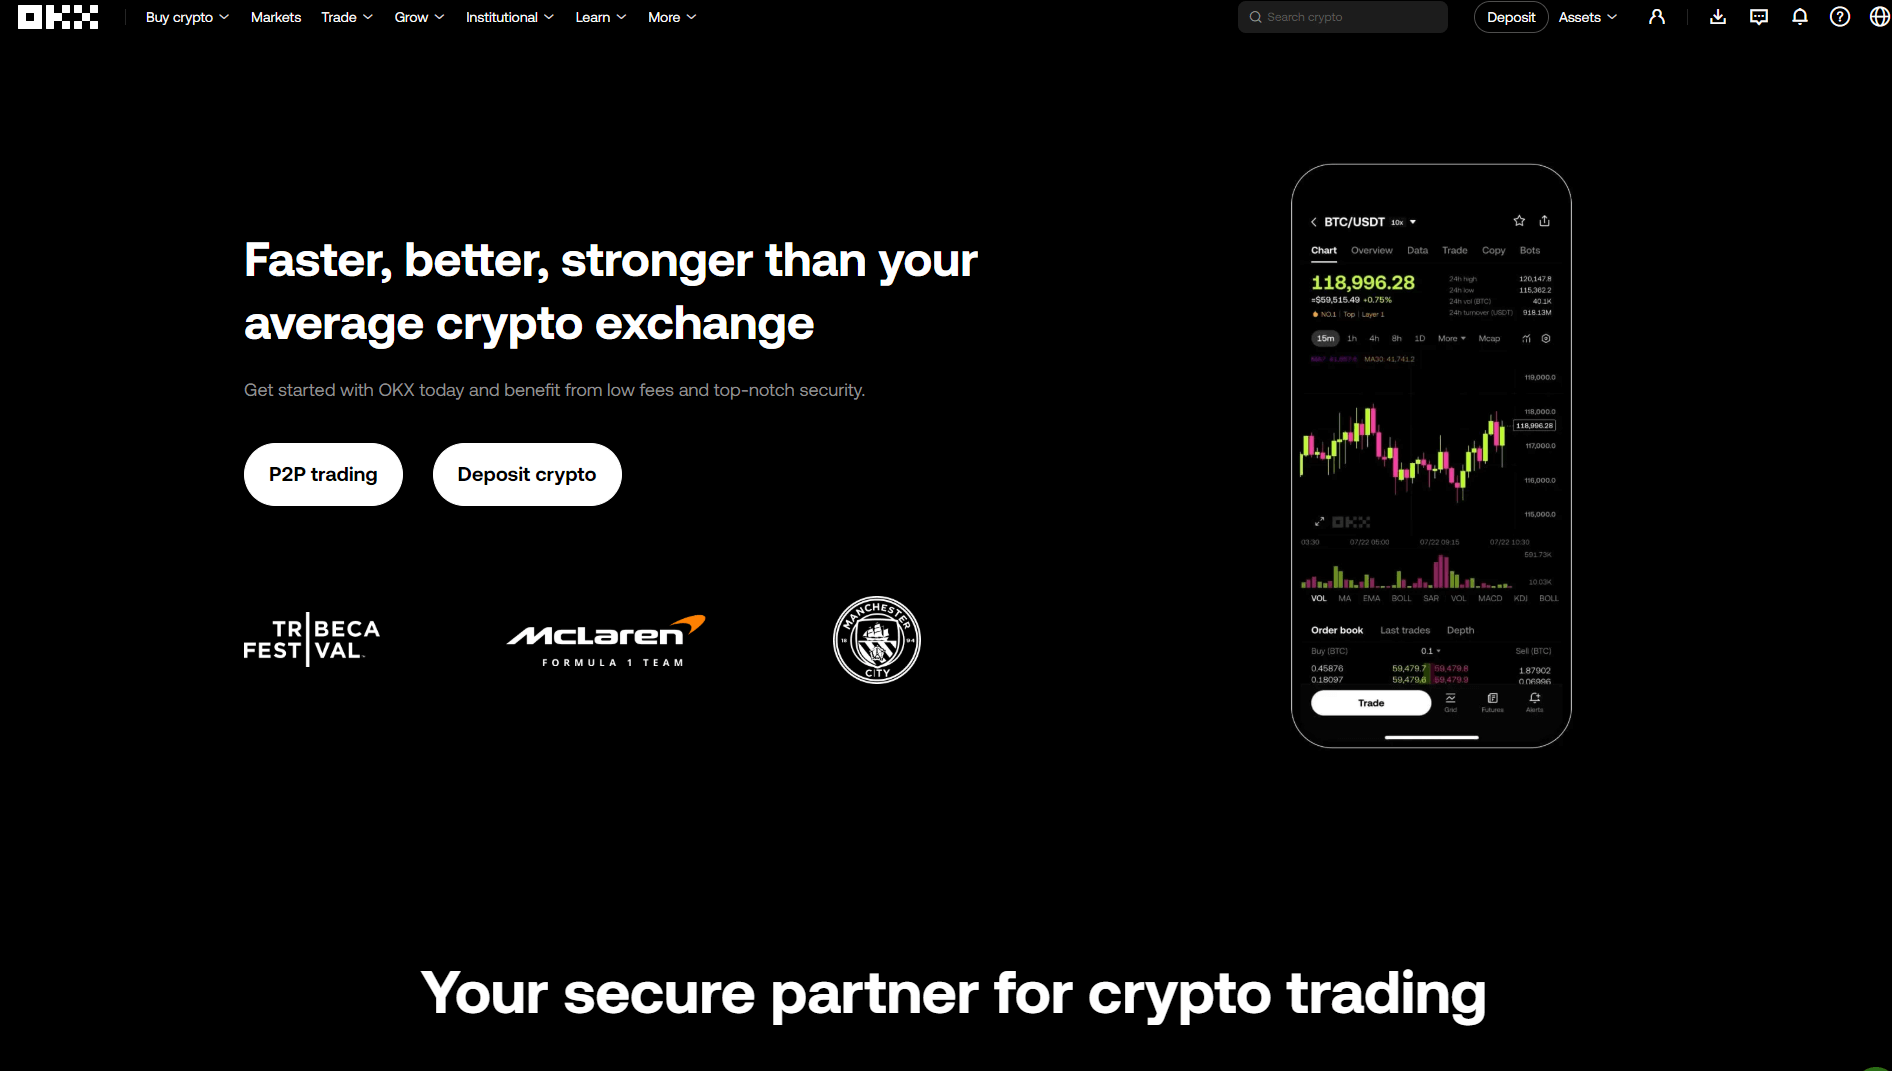
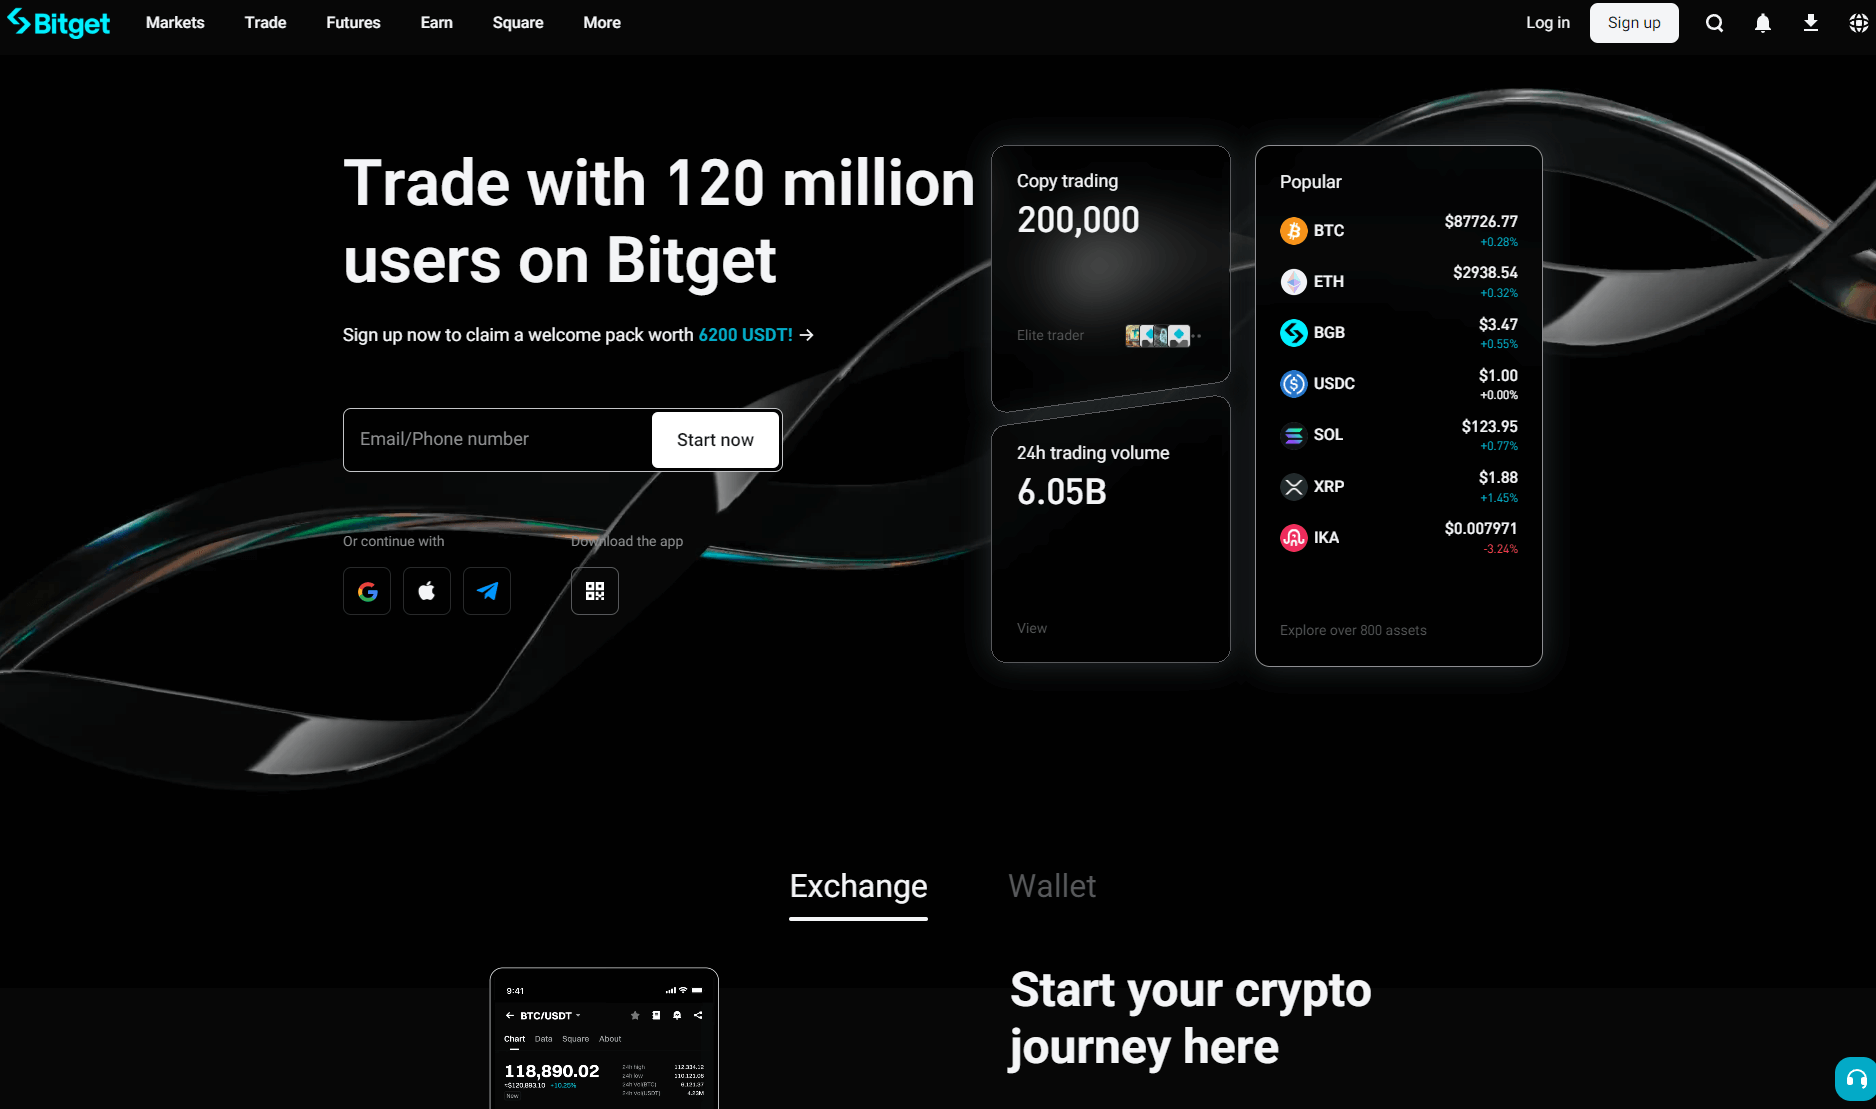
Binance · Bybit · OKX · Bitget. Calculate basic trading fees under the same conditions.
This comparison covers standard-tier base rates listed in official documentation. Actual rates may vary by account, country of residence, contracting entity, and trading pair. VIP rates, token payments, partner discounts, and limited-time promotions are excluded. This comparison is not an invitation to sign up or trade, nor does it determine eligibility to use any service.
Reference rates checked on 2026-10-30 · Not a quote for your current account · OKX rate is for the Standard Group specified in its notice. Results below include entry and exit trading fees only; VIP rates, token and partner discounts, funding, withdrawals, and conversion costs are excluded.
The default values are examples for demonstrating how to use the tool. Amounts are actual trade notionals, not margin, and entry and exit amounts are calculated separately.
| Exchange | Maker | Taker | Entry cost | Exit cost | Total (USDT) | Source and coverage |
|---|
Calculation formula and excluded costs
Entry notional × entry rate + exit notional × exit rate. Check your account history for the actual fee asset and conversion; USDT and USD are not treated as the same asset.
Slippage, profit or loss from price movements, funding, borrowing interest, withdrawal, and conversion costs are not included. Selecting Maker does not guarantee execution. The cost order in the table is not a ranking of safety or service quality.
Official rate sources and coverage (4 sources)
Rate sources and limitations
Checked on 2026-10-30Binance
Spot base rates · Enter account rates for futuresRegular User spot base-rate schedule. Example rates in the futures FAQ have not been adopted as current rates.
Document date: No separate date listed in the official schedule · Source checked: 2026-10-30
Open official source ↗Bybit
Based on official VIP 0 documentationComparison of crypto spot and USDT linear perpetual rates. Check actual rates under My Fee Rate after completing KYC.
Document date: 2026-10-12 · Sources checked: 2026-10-30
Open official source ↗OKX
Reference rates for the Standard Group in the notice effective 2026-09-09These are the Regular / Standard Group figures from the official en-gb notice. The current account fee schedule and applicability by legal entity must be verified separately; these should not be treated as definitive rates that apply worldwide.
Document date: 2026-08-20 · Evidence cross-check: 2026-10-30
Open official source ↗Bitget
Based on the official FAQ for standard tiersBasic spot and futures rates. Excludes VIP, BGB, and promotions.
Document date: 2026-08-20 · Evidence cross-check: 2026-10-30
Open official source ↗KRW SPOT · Separate currency group
Upbit and Bithumb KRW spot
Do not compare overseas USDT trading amounts and KRW amounts as if they were the same figure. The calculations below cover KRW spot only. The 2 domestic exchanges are not derivatives venues in this comparison.
For regular KRW orders on Upbit, refer to the 0.05% rate listed in the official Help Center. For Bithumb, check the coupon, account, and event conditions and the current rate, then enter it manually. Do not assume that the historical 0.04% notice is the current rate for all accounts.
Official Upbit fee information · Official notice on Bithumb coupon conditions
CALCULATE, DON'T GUESS
Calculator
Enter prices, quantities, and rates to calculate using your own conditions.
Inputs are calculated only on this screen and are not saved or transmitted. Prices and quantities must be within 0.00000001~1,000,000,000,000, and rates within 0~10%. Small results are shown in scientific notation rather than hidden as 0; displayed values are approximate.
RISK BUDGET · POSITION SIZE
Position size calculator
Sample inputs · based on price-difference lossEnter the maximum allowable loss, entry price, and stop-loss price to calculate the underlying asset quantity, assuming execution precisely at the stop-loss price. All three amounts must be entered in the same currency.
Reflects price-movement losses only. Fees, slippage, gaps, funding, and borrowing costs are excluded, so the actual loss may exceed the amount entered. This does not guarantee execution of a stop order or limit the loss.
Calculation formula · quantity units · scope
Underlying asset quantity = maximum allowable loss ÷ |entry price − stop-loss price|. Entry trade value = quantity × entry price. Stop-loss distance (%) = |entry price − stop-loss price| ÷ entry price × 100.
If the stop-loss price is below the entry price, the calculation treats it as a long position; if above, as a short position, based on price-difference loss. This assumes spot purchases or linear trades calculated in underlying asset units, and does not apply to inverse contracts, options, or products with separate contract multipliers. The quantity is not the number of contracts or the required margin. Leverage, liquidation, and available order balance are not calculated.
Results are theoretical and approximate. Before placing an actual order, check the exchange's quantity increments and minimum order size; do not round the quantity up. Supported ranges: prices and maximum allowable loss 0.00000001~1,000,000,000,000, calculated quantity up to 1,000,000,000,000, and trade value up to 1,000,000,000,000,000,000. Selecting a currency changes only the display and does not convert currencies.
CME Group: Principles for calculating position size using stop distance and risk tolerance ↗
01 / AVERAGE COST
Average entry price · breakeven price
All prices and fees use the same selected currency. The buy fee is added as an extra payment, and the purchased quantity is assumed to remain unchanged.
Add the buy fee as a cost paid in the displayed currency. If the fee was deducted from the coin quantity, enter the actual quantity received and do not add the already-accounted-for cost again. Selecting a currency changes only the display and does not convert currencies.
Documentation & worked example (GitHub)
View formula
Total acquisition cost = Σ[price × quantity × (1 + buy fee rate)]. Average entry price including fees = total acquisition cost ÷ total quantity. Breakeven price including the sell fee = average entry price ÷ (1 − sell fee rate). A separate calculation is required if the fee is deducted from the coin quantity.
02 / LINEAR P&L
Linear trade profit and loss
Assumes price-difference profit and loss for a linear USDT contract, excluding borrowing costs. This is not a calculator for inverse contracts, options, expiry settlement, or liquidation prices.
Leverage is reflected only in initial margin and ROI. It is not applied again to the quantity already entered. Liquidation, maintenance margin, and borrowing interest are not calculated.
Leverage and P&L calculation basis
Price-difference P&L = (exit price − entry price) × underlying asset quantity × direction (long +1, short −1). Net P&L is the price-difference P&L minus entry and exit fees and net funding expense. Leverage is not multiplied by the quantity again.
Simple initial margin = entry price × quantity ÷ leverage. ROI is net P&L relative to this initial margin; it does not account for fee reserves, maintenance margin, additional margin, or changes in collateral value. This assumes execution at the entered exit price without liquidation and does not guarantee that the result is achievable in practice.
03 / PRICE GAP
Kimchi Premium / Reverse Kimchi Premium Calculator
Compare the Korean KRW price of an asset with its overseas USD price. To enter an overseas USDT price, first convert it to USD.
Enter prices and the exchange rate manually. The KRW price range is 0.00000001~1,000,000,000,000,000, the overseas USD price range is 0.00000001~1,000,000,000,000, and the exchange rate range is 0.00000001~100,000,000. Confirm that the prices are for the same asset and timestamp, and do not treat a USDT price as USD.
Calculation formula and real-world trading
Kimchi Premium (%) = [Korean KRW price ÷ (overseas USD price × KRW/USD exchange rate) − 1] × 100. This is not a guaranteed arbitrage profit that accounts for trading fees, currency conversion, order books, deposit and withdrawal times, or regional usage restrictions. Entering prices from different timestamps will distort the comparison.
SIX VENUES · TWO QUOTE GROUPS
Prices and Market Sentiment
KRW spot and USDT spot are displayed separately. Prices are provided through official TradingView widgets, and index source data is collected hourly from daily data.
Provided by TradingView. Check each card for the exchange, trading pair, display currency, and whether data is delayed.
Major 6 venues · BTC spot
Go to the official BTC price cards for 6 venues ↓
Compare within the same currency group. Check each card for the trading pair and display currency. Symbols not provided by the data provider are not replaced with figures from another market.
BITCOIN FEAR & GREED · Daily source data
50 / 100 · NeutralProvider classification; not an investment signal
Source: Alternative.me Bitcoin Fear & Greed IndexSource observation 2026-11-05T00:00:00.000Z · Collection 2026-11-05T20:17:02.685Z (UTC)
Official prices · overseas 4 venues + Upbit · Bithumb
Official TradingView display area. KRW spot and USDT spot are in separate groups, subject to the provider's delays and coverage. Values are not extracted, stored, or automatically sent to the calculator.
KRW spot · Korea
Upbit · BTC/KRW
Bithumb · BTC/KRW
USDT spot · Overseas
Binance · BTC/USDT
Bybit · BTC/USDT
OKX · BTC/USDT
Bitget · BTC/USDT
OFFICIAL PUBLICATIONS · Original titles
Official financial and policy announcements
Check the titles and publication times of official Fed and SEC announcements, and visit the original sources.
Check the 1-hour interval · Titles and publication times are based on official sources.
SEC · Official announcement · 2026-11-04T16:28:00.000Z (UTC)
SEC Adopts Amendments to Update Definitions of Small Entity for Investment Companies and Investment Advisers ↗
SEC · Official announcement · 2026-10-30T19:30:00.000Z (UTC)
SEC Issues Exemptive Relief from Treasury Clearing Requirements for Certain Inter-Affiliate and Non-U.S. Repo Transactions ↗
SEC · Official announcement · 2026-10-29T16:42:37.000Z (UTC)
Two Entities Charged in $130 Million Fraud Scheme That Used False SEC Filings to Boost Investor Confidence ↗
Federal Reserve · Monetary policy · 2026-10-28T18:00:00.000Z (UTC)
Federal Reserve issues FOMC statement ↗
SEC · Official announcement · 2026-10-23T14:10:00.000Z (UTC)
SEC Announces Fiscal Year 2027 Examination Priorities ↗
SEC · Official announcement · 2026-10-20T13:25:16.000Z (UTC)
SEC and AMF Announce Supervisory MOU To Enhance Cooperation for Investment Advisers and Investment Service Providers ↗
SEC · Official announcement · 2026-10-20T12:51:00.000Z (UTC)
SEC, FSA Hold Autumn Financial Regulatory Dialogue ↗
SEC · Official announcement · 2026-10-19T17:19:43.000Z (UTC)
SEC Announces Roundtable on Machine-Understandable Data in the Age of Super Intelligence ↗
SEC · Official announcement · 2026-10-14T14:30:47.000Z (UTC)
SEC Small Business Advisory Committee to Discuss IPO Modernization and Regulation Crowdfunding ↗
Federal Reserve · Monetary policy · 2026-10-13T18:00:00.000Z (UTC)
Minutes of the Board's discount rate meetings on August 17, September 9, and September 16, 2026 ↗
SEC · Official announcement · 2026-10-09T14:59:00.000Z (UTC)
SEC Proposes Expanding Securities Eligible for Cross Trading by Registered Funds ↗
Federal Reserve · Monetary policy · 2026-10-07T18:00:00.000Z (UTC)
Minutes of the Federal Open Market Committee, September 15-16, 2026 ↗
SEC · Official announcement · 2026-10-06T20:30:24.000Z (UTC)
SEC Seeks Final Judgment Against Former Western Asset Co-CIO Ken Leech in Cherry Picking Case ↗
SEC · Official announcement · 2026-10-06T14:37:55.000Z (UTC)
SEC to Host Virtual National Compliance Outreach Seminar for Investment Companies and Investment Advisers ↗
SEC · Official announcement · 2026-10-05T12:47:36.000Z (UTC)
SEC Coordinates with Global Financial Regulators to Raise Fraud Awareness During World Investor Week ↗
Collection status by source
Federal Reserve · Monetary policy · Collection 2026-11-05T20:17:02.752Z (UTC)
SEC · Official announcement · Collection 2026-11-05T20:17:03.290Z (UTC)
SOURCES & CALCULATION
Sources and calculation basis
Review the data used and the calculation conditions.
Data sources
- TradingView — BTC spot prices from 6 exchanges. Trading pair, display currency, and delay status are based on each card.
- Alternative.me — Bitcoin Fear and Greed Index. Source data consists of daily index values.
- U.S. Federal Reserve (Fed) · U.S. Securities and Exchange Commission (SEC) — Titles, publication times, and links to the original texts of official announcements.
Fee criteria
Reference rate comparison date: 2026-10-30. Compares entry and exit trading fees for the standard tier. VIP, token payment, partner discounts, promotions, funding, borrowing, slippage, withdrawal, and conversion costs are excluded from the total. Actual rates may vary by account, region, product, and trading pair.
For OKX, the reference is the Standard Group rate in its announcement. Enter the rates shown in your account for Binance Futures and Bithumb. KRW and USDT are calculated separately.
Calculation and updates
The calculator uses the prices, quantities, and rates you enter; the initial figures are examples. You can check the formulas and included costs in each tool. Your inputs and results are processed only in this browser and are not stored or transmitted to a server.
Index and official announcements are checked every 1 hours, and open pages recheck the saved data every 5 minutes. Publication, source data, and collection times are displayed separately. If an update is delayed, the last valid data and its original timestamp are retained.
Terms of use
The fixed display order is not a recommendation ranking. Sorting by cost reflects only the calculated results for the entered conditions; partner links and codes are shown separately. Check benefits and eligibility on the official site. This tool does not provide investment advice or guarantee the safety or profitability of any exchange.
TOOLS
What would you like to check?
Select a cost to compare or an item to calculate. Inputs are processed only in this browser.
Position size →
Calculate the underlying asset quantity from the permitted loss amount, entry price, and stop-loss price
Trading costsFee Comparison →
Compare 4 exchanges using the same amount and order conditions
Buy planAverage entry price · breakeven →
Calculate the average price and break-even sell price after buying in installments
Trade P&LLong/short P&L →
Includes entry and exit prices and trading fees
Price differenceKimchi premium/discount →
Calculate using KRW and overseas prices and exchange rates entered manually
Market checkPrices and Market Sentiment →
BTC prices from 6 exchanges and the Fear & Greed Index
Official informationFinancial policies and announcements →
Fed and SEC announcement titles, publication times, and original texts
EXCHANGE ACCESS · Partner section
Exchange links and codes at a glance
These are partner links. Coinpop may receive compensation for eligible sign-ups and trades. Check eligibility and restrictions first, and review the current terms for discounts and rebates on the sign-up page. Trading involves the risk of loss. The order below is separate from fee calculations and safety assessments.
 Partner
Bybit
Code COINPOP
Check sign-up terms ↗Read terms and risks first Partner
Binance
Code COINPOP
Check sign-up terms ↗Read terms and risks first Partner
OKX
Code COINPOP
Check sign-up terms ↗Read terms and risks first Partner
Bitget
Code coinpop
Check sign-up terms ↗Read terms and risks firstSources and calculation basis
Check source references and fee and calculation terms all in one place →