
The key to assessing TSMC’s stock outlook is not only whether AI-related demand increases, but also whether it can maintain margins and free cash flow even after 2nm enters mass production. Third-quarter 2026 results confirm growth and cash generation, but the fact that a company is good does not, by itself, mean it is attractive at any price. This article separately examines results, capital expenditure, ADR units, and the earnings assumptions embedded in the price.
Analysis and editing: CoinPop Editorial Team · Final verification: October 16, 2026 KST. The reporting period is July–September 2026, and the announcement date is October 15. We used TSMC’s consolidated TIFRS results and unaudited summary financial statements. Fourth-quarter figures are company guidance, not confirmed results. We cross-checked TSMC’s official third-quarter materials and the earnings release filed with the SEC.
Is TSMC worth investing in?
CoinPop analysis: There are reasons to consider TSMC for long-term investors seeking exposure to both advanced-process demand and cash generation. However, investors should verify three conditions: revenue growth from new processes leads to margin recovery; cash remains after substantial capital expenditure; and the purchase price does not require unrealistic earnings assumptions. The same conclusion does not apply to investors expecting short-term share price gains or unable to tolerate geopolitical risk.
| Question | Evidence supporting consideration | Conditions that call for caution |
|---|---|---|
| Is the business growing? | Third-quarter revenue in U.S. dollars rose 41.2% year over year | Interpreting all HPC as AI revenue or assuming the high growth rate will continue |
| Is growth translating into cash? | Quarterly free cash flow was positive after capital expenditure | Annualizing one quarter without accounting for quarterly investment timing and working capital changes |
| Is the price reasonable? | Earnings and price can be compared on the same ADR basis | A price that only makes sense if optimistic earnings and a high valuation multiple are sustained simultaneously |
The key is not “buy because AI has promising prospects.” Even when results improve, the share price can lag if the P/E multiple the market is willing to pay declines. Conversely, a slowdown in growth alone does not mean the business has lost its value. The calculations below are tools for examining these two variables separately.
What is TSMC, and where does it make money?
TSMC (Taiwan Semiconductor Manufacturing Company) is a pure-play foundry that manufactures semiconductors designed by its customers. In the United States, it trades as NYSE: TSM ADRs, and in Taiwan as TWSE: 2330 common shares. The investment question is not only whether a particular chip design succeeds, but also whether TSMC can competitively provide the manufacturing technology, production capacity, and advanced packaging required by multiple customers. The company’s business description is available in the company overview in its official earnings release.
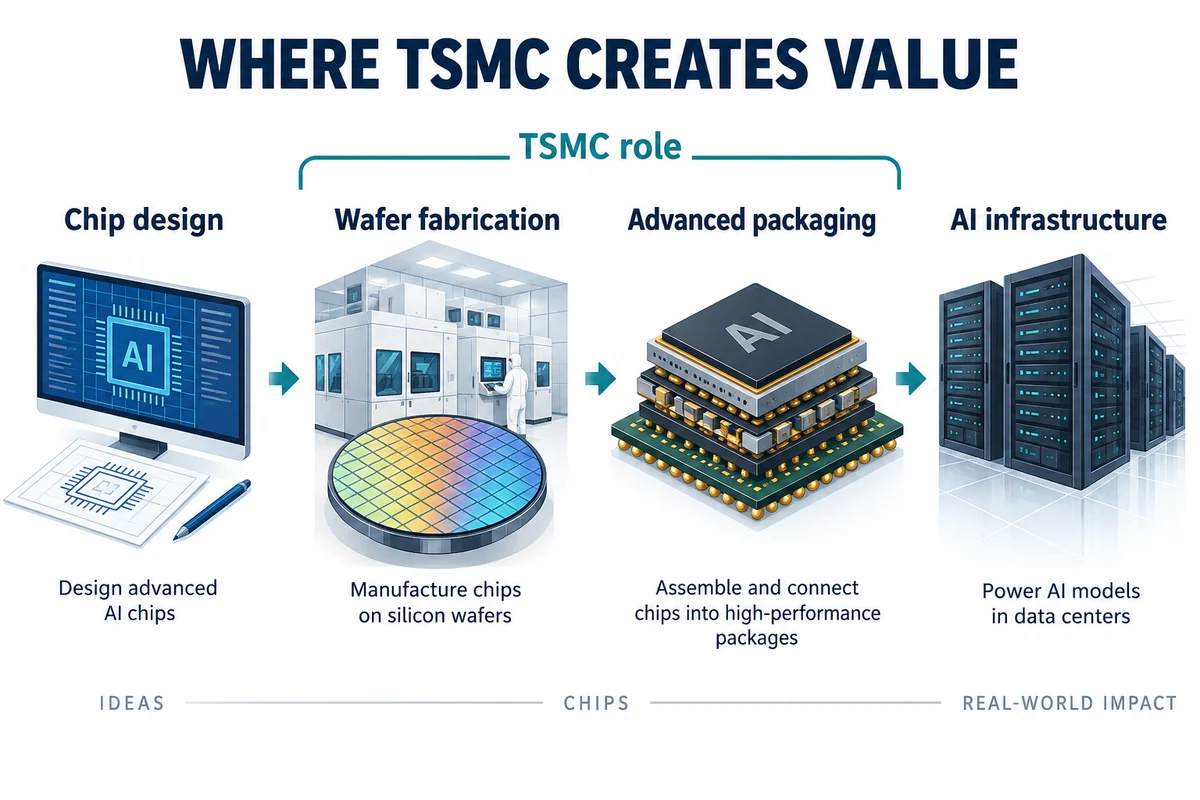
Design companies are more directly exposed to product and software ecosystems and customers’ purchasing decisions, while foundries are more directly exposed to process transitions, yield, production capacity, and returns on investment. Therefore, do not directly apply a design company’s revenue growth rate to TSMC’s fair P/E. To compare different positions in the supply chain, it may be useful to read this alongside an analysis of Nvidia’s AI results, cash flow, and customer financing support.
TSMC is also not immune to customer orders and semiconductor cycles. Between the fact that a customer designs its own chips and the conclusion that TSMC’s manufacturing orders will fall, there are additional factors to verify, including process selection, volumes, and manufacturing partners. TSMC’s revenue or margins should not be treated as certain based solely on announcements of new AI products.
Third-quarter 2026 results: growth and margins moved in different directions
The key takeaway from the announcement is that strong revenue growth coincided with a sequential decline in margins. Net income in the table is attributable to owners of the parent. Amounts in NT$bn mean billions of New Taiwan dollars, and US$bn means billions of U.S. dollars; neither is in Korean won. Sequential and year-over-year comparisons are on a consistent currency and accounting basis.
| Metric | Third quarter 2026 | Second quarter 2026 | Third quarter 2025 |
|---|---|---|---|
| Revenue, US$bn | 46.72 | 40.20 | 33.10 |
| Revenue, NT$bn | 1,494.24 | 1,270.38 | 989.92 |
| Gross margin | 66.4% | 67.7% | 59.5% |
| Operating margin | 58.7% | 60.3% | 50.6% |
| Net income attributable to shareholders, NT$bn | 763.06 | 706.56 | 452.30 |
| Diluted EPS, NT$ per common share | 29.43 | 27.25 | 17.44 |
| Diluted EPS, US$ per ADR | 4.60 | 4.31 | 2.92 |
Source: 3Q26 unaudited summary financial statements, page 2, earnings release. Displayed precision follows company materials; rounding differences may occur.
What net income growth alone can obscure
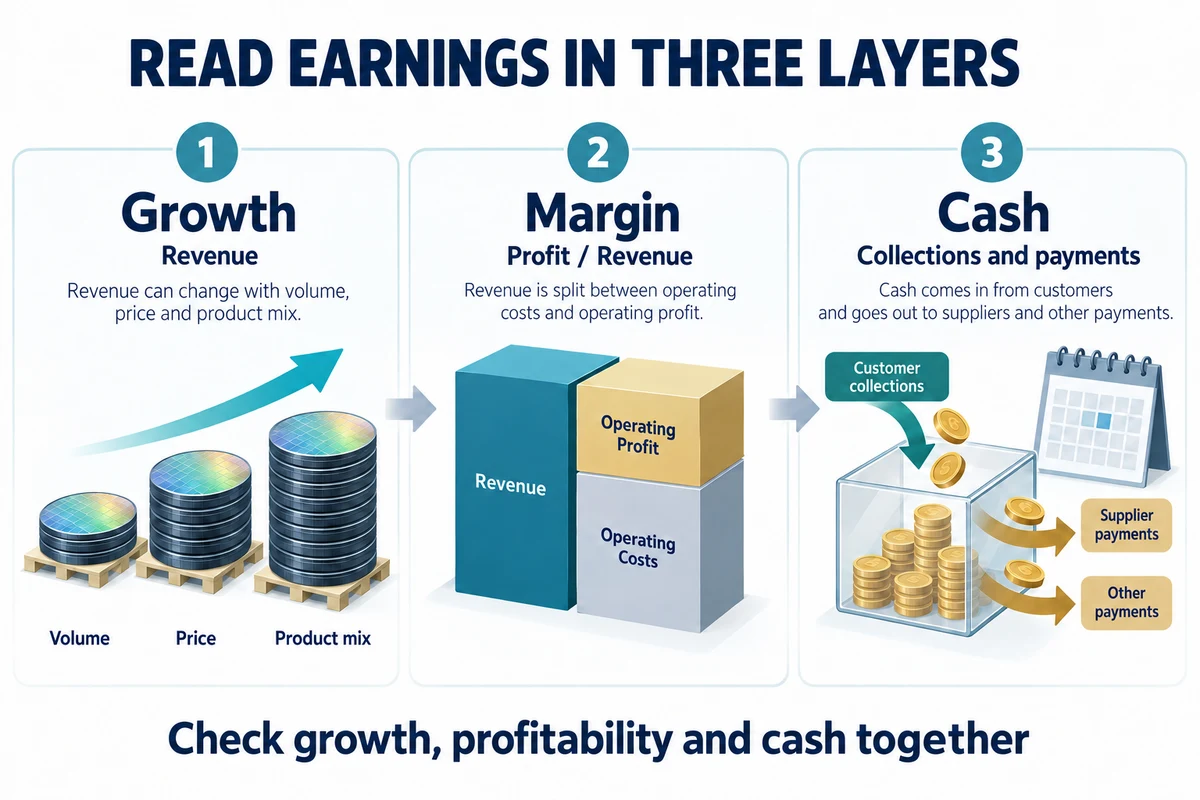
Revenue in New Taiwan dollars rose sequentially by 17.6%, operating income by 14.3%, and net income attributable to shareholders by 8.0%. Gross margin declined by 1.3 percentage points, and operating margin by 1.6 percentage points. The company cited the dilutive effect of the initial ramp-up of N2 (2nm) as the main reason for the decline in gross margin.
The comparison base for non-operating items also affected net income. Non-operating income and expenses declined from NT$95.83bn in the prior quarter to NT$34.59bn, and the company explained that gains related to the disposal and valuation of its VIS stake in the prior quarter did not recur. Therefore, it would be an overstatement either to claim that AI demand is collapsing simply because net income grew more slowly than revenue, or to conclude that all margin pressures will disappear because some factors were temporary. The explanations in pages 2–3 of the management report should be considered alongside the next quarter’s results.
HPC at 68% and advanced processes at 79% have different denominators
In the third quarter, HPC (high-performance computing) accounted for 68% of net revenue. By contrast, the 79% for advanced processes of 7nm and below and the 8% for 2nm are based on wafer revenue. HPC may include demand beyond AI, so it should not be restated as “AI accounts for 68% of total revenue.” Nor can exact AI revenue be derived by adding or multiplying shares with different denominators.
CoinPop analysis: The rising share of 2nm revenue signals that the technology transition is translating into sales. However, it supports a case for returns on investment only if yields, utilization, and product mix improve after the initial costs are absorbed. How the share of 2nm revenue and the company’s overall margins move together is central to the next stage of analysis.
What fourth-quarter guidance tells us—and what it does not
The company forecast fourth-quarter revenue of US$52.3–54.3bn, gross margin of 65–67%, and operating margin of 56.5–58.5%. The margin forecast is based on an exchange-rate assumption of US$1 = NT$31.8. Comparing the midpoint of the revenue range, 53.3, with third-quarter revenue of 46.72 implies an increase of about 14.1%. This is CoinPop’s arithmetic calculation, not a confirmed growth rate or analyst consensus.
Annual dollar revenue is projected to grow by approximately 44%. However, a revenue growth outlook is not the same as an outlook for margins to rise from the previous quarter. Read the scope and assumptions in pages 9–10 of the company presentation separately and as stated.
How much cash remains after capital expenditures?
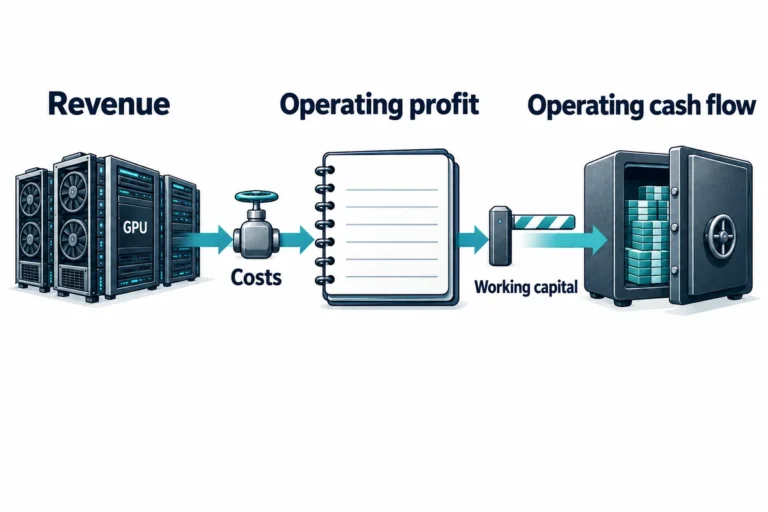
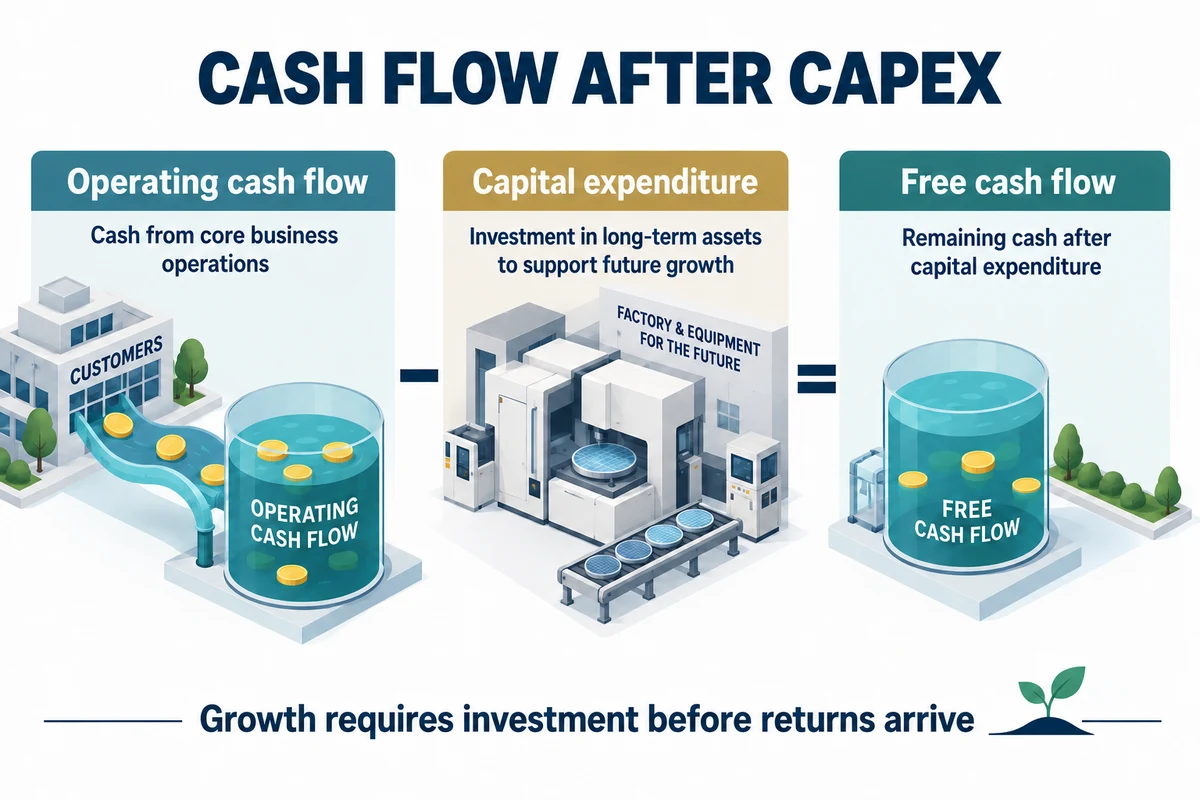
To grow, a foundry must first spend money on factories and equipment. Therefore, alongside net income, we review operating cash flow − capital expenditures = free cash flow (FCF). TSMC uses this definition as well. In the third quarter, operating cash flow was NT$919.77bn, capital expenditures were NT$443.21bn, and FCF was NT$476.56bn.
| Item | Amount / calculation | Interpretation and caveats |
|---|---|---|
| Operating cash flow | 919.77 | Actual cash flow from operations, not earnings |
| Capital expenditures | 443.21 | Spending to acquire factories and equipment |
| Company-defined FCF | 919.77-443.21=476.56 | A metric before deducting dividends |
| FCF / net revenue | 476.56 / 1,494.24 ≈ 31.9% | Calculated by CoinPop. A single-quarter ratio, not a fixed long-term margin |
| Net cash outflow from investing activities | 266.79 | A figure that nets capital expenditures against other investment-related cash flows |
| Incorrect substitution | 919.77-266.79=652.98 | A figure that substitutes net cash outflow from investing activities for capital expenditures; it is not company-defined FCF |
Source: Management Report, page 5 and Condensed Statement of Cash Flows, page 4. The company cited U.S. Treasury investment tax credits as a major factor behind other investment-related inflows. Do not treat all of those inflows as operating revenue or recurring cash generation.
The quarterly FCF reported by the company increased from NT$287.36bn in the previous quarter. However, because the timing of payments for equipment, taxes, and working capital can vary, do not multiply NT$476.56bn by four and treat the result as normalized annual FCF. The difference between NT$4,016.98bn in cash and marketable securities and NT$1,031.58bn in interest-bearing debt, as reported by the company, is net cash of NT$2,985.40bn. This is not an amount calculated after deducting all liabilities. A cash balance is a financial position at a specific point in time, while FCF is a flow over a period.
CoinPop analysis: Current public figures provide positive evidence that cash remains available even as the company invests for growth. The next question is whether the same cash-generation capacity will continue through process transitions and expanded overseas production. Rather than looking only at the total announced investment in factories, we need to connect actual payments, depreciation, utilization, and margins.
What is the difference between the U.S. TSM ADR and Taiwan’s 2330?
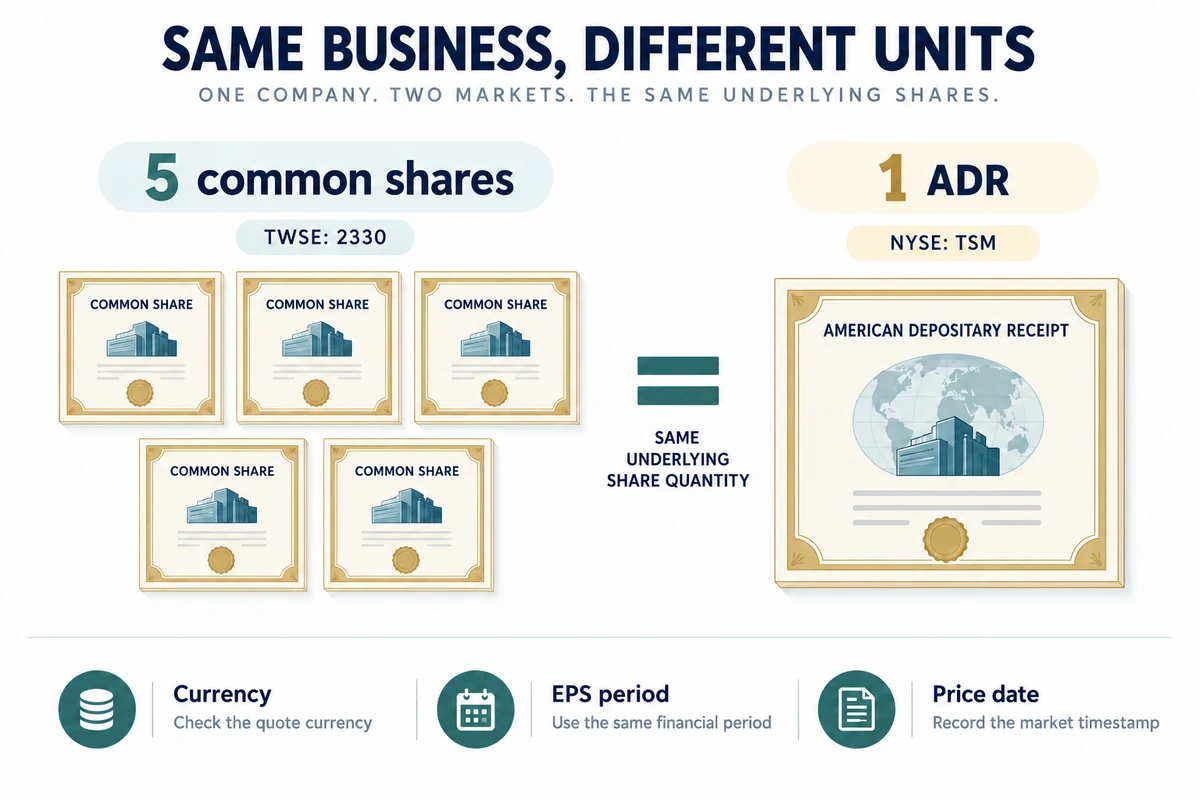
One TSMC ADR represents five common shares. Dividing the TSM price traded in U.S. dollars directly by common-share EPS of NT$29.43 produces an incorrect P/E ratio. Use earnings per ADR in U.S. dollars with the ADR price, and earnings per common share in Taiwan dollars with the Taiwan common-share price. This ratio is stated in the notes on pages 2–3 of the official financial statements.
| Category | Taiwan common shares | U.S. ADR |
|---|---|---|
| Listing / ticker | TWSE: 2330 | NYSE: TSM |
| Investment unit | One common share | Represents five common shares |
| Currency for price and EPS | Compare Taiwan dollars with Taiwan dollars | Compare U.S. dollars with U.S. dollars |
| P/E denominator | Earnings per common share for the same period | Earnings per ADR for the same period |
The dollar EPS reported in filings uses the conversion basis for the relevant period. It may not be exactly the same as a figure calculated by arbitrarily applying the spot exchange rate on the same day. The two markets also have different trading hours, so a price difference at different times should not be immediately interpreted as undervaluation or risk-free arbitrage. For Korean investors, won-denominated returns may also be affected by exchange rates, trading costs, taxes, and ADR-related fees in addition to share prices. Check the specific terms with your brokerage and the applicable regulations.
How to calculate whether TSMC stock is expensive
First, fix the price reference. The example below uses the US$430.00 closing price at the end of the regular U.S. session on October 14, 2026. This was the closing price at 4 p.m. Eastern Time, or 5 a.m. Korea Time on October 15, and was before the third-quarter earnings announcement. It does not refer to intraday trading on October 15 or that day's closing price. The closing price was cross-checked against historical quotes from Stock Analysis and historical quotes provided by FinancialContent. For a real-time purchase decision, use the latest quote from your brokerage.
Combining reported ADR EPS of US$3.14 for Q4 2025 with reported ADR EPS of US$12.40 for January–September 2026 gives an approximate trailing 12-month dollar-converted EPS of US$15.54. This is an arithmetic sum that includes period-specific exchange-rate conversions and rounding in the reported figures, so it may differ from data providers’ definitions of trailing P/E. 430.00 / 15.54 ≈ 27.7x, and this is not a forward P/E based on earnings for the next 12 months. The supporting figures are from official Q4 2025 results and nine-month cumulative EPS in the Q3 2026 financial statements.
The figure of 27.7x alone is not enough to determine whether the stock is cheap or expensive. The multiple investors require will vary depending on future earnings growth, volatility, capital intensity, and geopolitical risk. Quantitative comparisons with other companies or historical P/E ratios require data using the same reference date, trailing or forward basis, and accounting standards. This article does not make up an unverified peer-company average or consensus price target.
What level of earnings is needed to justify the same price?
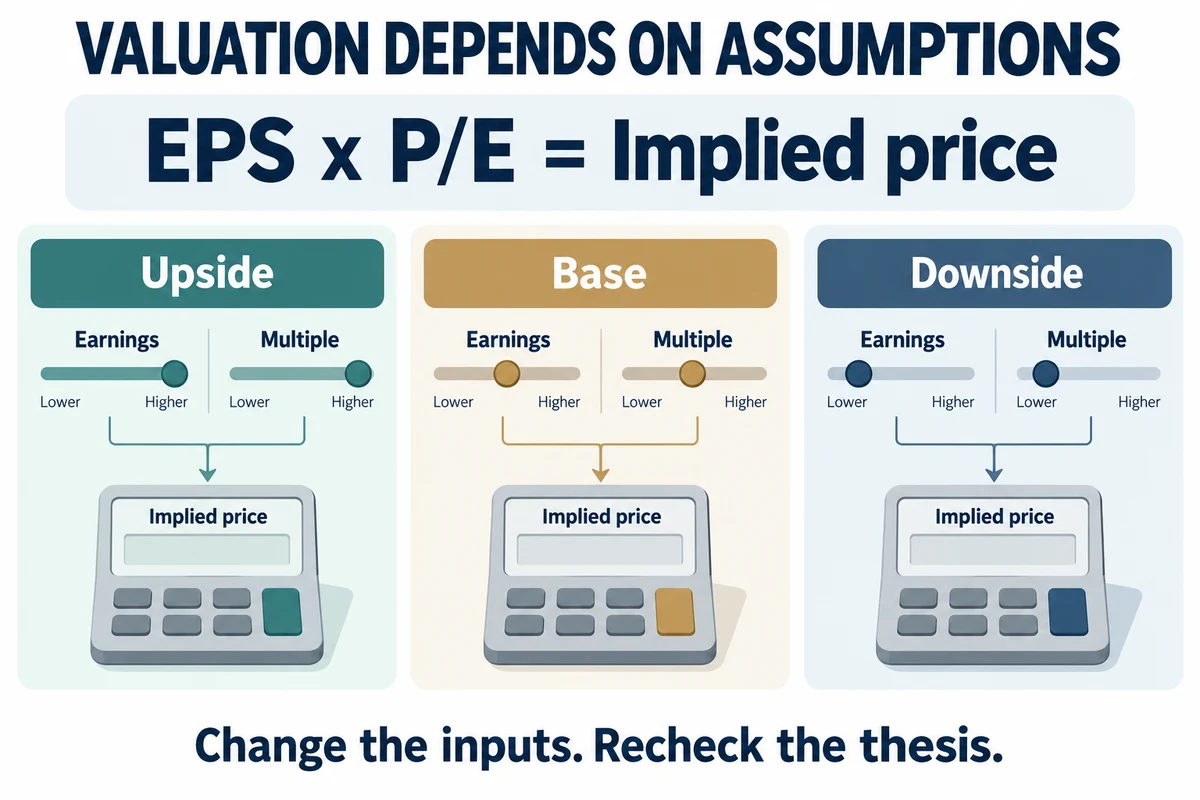
The general formula is ADR price = annual ADR EPS × P/E. Holding the price at US$430.00, the required annual EPS is US$21.50 at 20x, US$17.20 at 25x, and approximately US$14.33 at 30x. This is not a forecast that “those earnings will be achieved”; it is a calculation that works backward from the assumptions implied by the price. Do not use quarterly EPS of US$4.60 multiplied by 4, or US$18.40, as confirmed annual earnings or forward EPS.
| Assumed annual ADR EPS | P/E 20x | P/E 25x | P/E 30x |
|---|---|---|---|
| US$14 | 280 | 350 | 420 |
| US$17 | 340 | 425 | 510 |
| US$20 | 400 | 500 | 600 |
Calculation assumptions: EPS values of US$14, US$17, and US$20 and P/E multiples of 20x, 25x, and 30x in the table are illustrative assumptions set by CoinPop. They are not company guidance for a specific fiscal year, market consensus, or a forecast for the next 12 months, and they do not include dividends, exchange rates, taxes, transaction costs, or the probability of achieving the assumptions. The table is intended to show that EPS and multiples can decline at the same time.
For example, even if assumed EPS rises by approximately 17.6% from US$17 to US$20, the arithmetic price falls from US$425 to US$400 if the P/E multiple declines from 25x to 20x. This example is not a forecast of the actual share price. It shows that business growth and stock returns are not one-to-one. The distinction between confirmed facts and forecasts in the FOMC interest rate decision and dot plot commentary can also be a useful reference for understanding the relationship between interest rates and valuation multiples.
The counterargument: What could change the investment thesis?
To assess the optimistic case, we should also define the conditions that would challenge it. Even with growth in advanced processes, the recovery in margins may be delayed if yields, initial costs, and overseas production costs remain a burden. Customer order adjustments and semiconductor industry cycles may delay returns on expanded capacity. Geopolitical tensions, export controls, natural disasters, and power or production disruptions are difficult to assess based on a single quarter's income statement. These are factors to review alongside the risk disclosures in the company’s earnings release.
| Scenario | Required conditions | Counterevidence / indicators to monitor |
|---|---|---|
| Optimistic | Demand for advanced processes remains strong, initial ramp-up costs are absorbed, and cash increases after investment | Whether a larger share of advanced processes translates into actual margin improvement and FCF |
| Baseline | Revenue is growing, but the pace of margin improvement is limited by process transitions and investment costs. | Achieves the fourth-quarter guidance range; cumulative cash flow trends |
| Risk | Customer order adjustments, rising costs, and policy or production disruptions coincide | Lower guidance, deteriorating utilization and margins, slowing cash generation, and continued capital spending |
What should we track before the next earnings report?
- Monthly revenue: Check reported figures and year-over-year comparisons in TSMC's official monthly revenue releases. Do not compare growth in monthly revenue in New Taiwan dollars directly with quarterly guidance in U.S. dollars.
- 2nm share and margins: Consider both the revenue contribution from the technology transition and whether initial costs are being absorbed.
- Cumulative FCF and investment payments: Compare operating cash flow and capital expenditures across several quarters, rather than focusing on a single quarter's inflow.
- Customer demand and order quality: Distinguish the company's account of confirmed demand from customers' actual investment capacity and cash resources.
- Assumptions implied by the price: Apply the latest ADR price to EPS for the same period and in the same currency, and check whether the analysis still holds at a lower multiple.
The approach of separating product and business prospects from the current price when evaluating a growth stock also applies to Tesla delivery, earnings, and valuation analysis. However, avoid comparisons that directly apply the revenue mix or valuation multiples of an automaker or service company to a foundry.
Frequently Asked Questions About TSMC Investment Analysis
Are TSMC and TSM the same company?
TSMC is the company's commonly used name, while TSM is the ticker for its ADR listed on the New York Stock Exchange in the United States. The ticker for its Taiwan common shares is 2330, and one U.S. ADR typically represents five common shares.
What was the most important change in the third-quarter 2026 results?
Revenue in U.S. dollars increased 41.2% year over year, but the gross margin fell 1.3 percentage points quarter over quarter. Strong demand and the initial costs of new processes should be analyzed together.
Can the 68% HPC revenue share be described as the AI revenue share?
No. HPC is not synonymous with AI, and its denominator differs from that of process-node shares. Do not use this figure alone to derive an exact AI revenue share that the company has not separately disclosed.
How is TSMC's free cash flow calculated?
The company's definition is operating cash flow less capital expenditures. For the third quarter of 2026, that is 919.77 − 443.21 = 476.56 NT$bn. The result would differ if net cash outflow from investments, which is offset by items such as investment asset disposals, were used instead of capital expenditures.
Can the share price fail to rise even when earnings are strong?
Yes. Growth expectations already reflected in the price, future earnings assumptions, market valuation multiples, and interest rates all play a role. Do not attribute a share-price change on a particular trading day to a single earnings item.
Can TSMC be considered undervalued now?
The reference price and approximate trailing EPS in this article alone are not enough to establish that the stock is currently undervalued. Recheck the latest price, sustainable annual earnings, the valuation multiple you require, and the risks. The calculation table is a tool for making those assumptions transparent, not a personalized buy recommendation.
Sources, Scope of Verification, and Investment Risks
Key figures were verified against TSMC's third-quarter 2026 earnings release, management report, unaudited financial statements, and SEC filings. The price used is only the specified historical regular-session closing price; real-time quotes are not provided. This is not a review based on a factory visit or personal stock trading, and it distinguishes the company's outlook from CoinPop's calculations and conditional analysis. The five explanatory images in the article are general diagrams created by CoinPop using AI; the key answers, figures, and assumptions are also provided in the article text and HTML tables outside the images.
- TSMC's official third-quarter 2026 materials — announced October 15, 2026
- SEC EDGAR: Documents attached to TSMC's third-quarter earnings release — Includes a note that the figures are unaudited and subject to board approval
- TSMC 3Q26 summary financial statements — Consolidated income statement, cash flows, and ADR ratio
- TSMC 3Q26 management report — Margin changes, revenue mix, and investment cash flows
- TSMC 3Q26 earnings presentation — FCF definition and fourth-quarter and full-year outlook
- TSMC 4Q25 earnings release — Previous quarter used to estimate trailing 12-month EPS
General investment information: This article is not investment advice tailored to any reader's assets, liabilities, investment horizon, or tolerance for losses. Risks include loss of principal, exchange-rate fluctuations, and business, policy, and geopolitical risks; scenarios are not guaranteed to materialize. No assumptions are made about holdings or personal investing experience, and this article contains no exchange sign-up or affiliate CTA. Errors or changes will be corrected by checking against the relevant official materials.